Three-dimensional, Converted Wave Imaging of the Mantle:
Applications to the Earthscope Transportable Array
By:
Dr. Gary L. Pavlis
Department of Geological Sciences
Indiana University
When: |
Thursday, Nov. 5, 2009, 10:30 a.m. to 11:30 a.m. |
Where: |
BEG Main Conference Room, 10100 Burnet Road, Bldg 130, Austin, Texas 78758 |
Host: |
Gail Christeson, UTIG |
You are invited to watch this Mediasite presentation by clicking on the link:
http://mediasite.beg.utexas.edu/mediasite/Viewer/?peid=c184edeced504cf79befb8a6e85b1b95
Abstract
The Transportable Array (TA) component of Earthscope is a large aperture, broadband seismic array with a nominal station spacing of 70 km. The current position of the array is along an approximately 300 km wide, NS swath from west Texas to the Canadian border. It began operation 6 years ago on the west coast and is in a continuous roll that will cover the entire lower 48 states by 2013. The array was designed for imaging the crust and mantle of the entire continent with an original focus on seismic tomography. Over the past several years I have been developing the technology for imaging forward scattered P to S and S to P conversion data from teleseismic earthquakes recorded on arrays like the TA. This is challenging because conventional migration methods are designed assuming data are not spatially aliased. The method I have developed uses spatial smoothers to estimate plane wave response consistent with physical limits imposed by diffraction. I will show recent results using P to S conversion data to image the entire western US west of the front range of the Rocky Mountains.

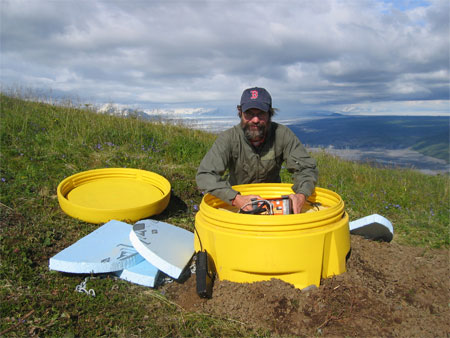
above Bering Glacier in Alaska
The images show the 410 and 660 discontinuities as continuous features throughout the region. In addition, we image a series of interesting but largely unexplained features in the upper part of the transition zone. We see multiple features that could be interpreted as the scattered wave lithosphere-asthenosphere boundary. The results also indicate scattered wave structure above the 410 discontinuity that correlate with a volume interpreted in tomography data as the Farallon slab hung up at the 410 discontinuity. The result will be compared to related imaging done for Bolivar in the SE Caribbean and STEEP in SE Alaska.


