Syn2D module
Syn2D is a 2-D Cartesian tomography teaching tool contributed by Lapo Boschi and slightly modified by Thorsten Becker. The user can choose between
- a checkerboard or PGM grayscale image "Earth" structure,
- different, random station/receiver distributions,
- different synthetic noise levels
The code will then trace rays through the input medium, and create synthetic datasets. The latter can then be inverted using LSQR least squares for different parameterizations and normal damping choices. The code creates map-view plots of the inverted structure and output for L-curve tradeoff analysis.
Availability
Syn2D is included in the 1.0 release of the SEATREE package.
Requirements
A Fortran compiler, such as gfortran or g77. For Linux, we suggest to use the (freely available) Intel ifort compiler.
Installation
Change into the Syn2D installation directory, and type "make". Ideally, this will compile all source code, and run the needed scripts for steps 1) - 3) below.
Documentation
Syn2D works in three steps:
1) Produce a model (from an gray scale image, or a checkerboard). Create a plot of the original model.
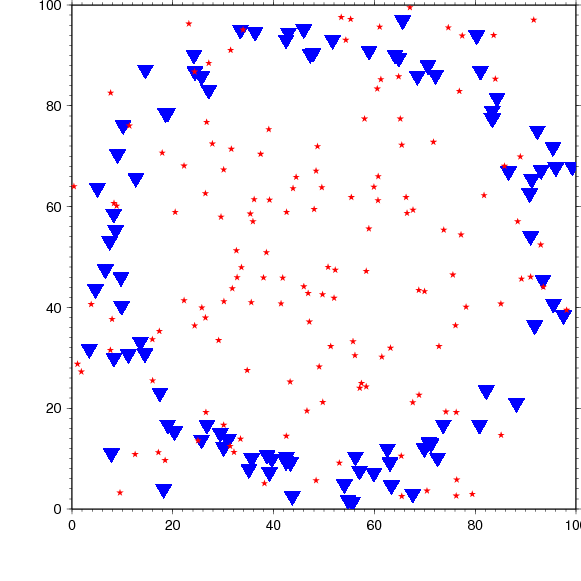
2) Shoot rays through the region, add noise, and produce synthetic data. Create a plot with ray coverage.
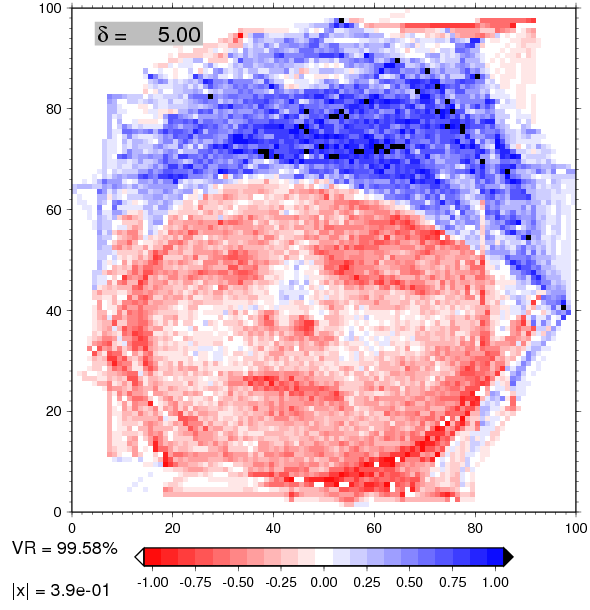
3) Invert the synthetic data for different settings of damping and parameterization. Create a plot.
GUI interface
The GUI interface to Syn2D allows access to the following steps of Syn2D usage:
- Plot Type: switches between postscript based/GMT output and Matplotlib direct plotting
- Input Model Type: select a checkerboard model, or a square raster image gray scale file for synthetic "Earth" structure
- Checkerboard size: control box size if checkerboard is selected
- Make model / Plot model: create synthetic Earth model, and display a plot of it
- Station mode: allows for different geometries for the random station (seismometer) and event (earthquake) distributions
- Synth Gen Data Pnts: Total number of traveltime observations generated from the station-event geometry, if feasible with other settings
- Num Recordings per Event: number of stations which record each event, if there are more than Num stations, a random subset will be selected.
- Noise: random noise added on top of travel time observations
- Generate data / Plot data: generate the dataset of synthetic travel times, and display data (by selecting stations, events, or raypaths)
- Load/Edit?: interactive editor for station/event geometries
- Damping value: roughness damping value for the inversion of the synthetic data
- Invert Data / Plot inversion: perform and visualize the inversion.
Both GMT and MatPlotLib? plotting windows have their own setting panel underneath the display window.
Python wrappers
See syn2d.py.
Command line shell interface
The original Fortran tools are described in a REAMDE file, but scripts have been slightly rewritten as follows:
Under bash scripting, all parameters for steps 1) - 3) are controlled in a file global_para.dat This file has all control variables and gets read when "make" is executed in the main syn2d installation directory. Steps 1) - 3) from above are computed, and output is stored, in subdirectories makemodel, makedata, and inversion, respectively.
The following variables are read in sequentially in free format ("#" indicating a comments) from global_para.dat
# xtot  dx      ndata   sigma  ipick   station_mode     mtype
100     1       7500    1      80      4        image2
# settings for damping parameters in inversion
#"0. 0.01 0.025 0.
"5."
Here,
- xtot
- is the horizontal and vertical extend of the square region of interest (region can be rectangular in principle)
- dx
- is the spacing for input and output model pixels (those can be different in principle)
- ndata
- the total number of synthetically generated data points, i.e. station-receiver pairs
- ipick
- the number of recordings (at different stations) for each event
- station_mode
- the station-receiver randomized distribution mode 1: stations and events are evenly distributed over the area 2: stations are clustered in the center of the region, and events are evenly distributed 3: stations are located in a roughly circular region around evenly distributed events 4: stations and events are located in a roughly circular region
- mtype
- if mtype is
- chkbd: will construct a regular, checkboard input model
- else: will use a square (n by n pixels) ASCII format PGM grayscale image (in the above example image2.pgm) to construct the model. n has to be identical to xtot. A simple AWK script takes care of the conversion into a format for syn2d.
- damp
- the last parameter is the norm damping setting for the inversion step. Several damping values can be given as a string. In this case, the code will loop through different damping settings and record variance reduction and model norm (for L curve analysis).
Output files:
- Step 1 - makemodel
- mtype.px is the input data needed for step 2). mtype.[ps|gif] are plots of the original model
- Step 2 - makedata
- rayc.mtype.[ind|pnt|rhs|xxx] are output data for step 3). rayc.mtype.station_mode.[1-3].[ps|gif] are plots of stations, stations and events, and ray coverage, respectively
- Step 3 - inversion
- maps/rays.mtype.damp.[ps|gif] are plots of the output for the selected damping


