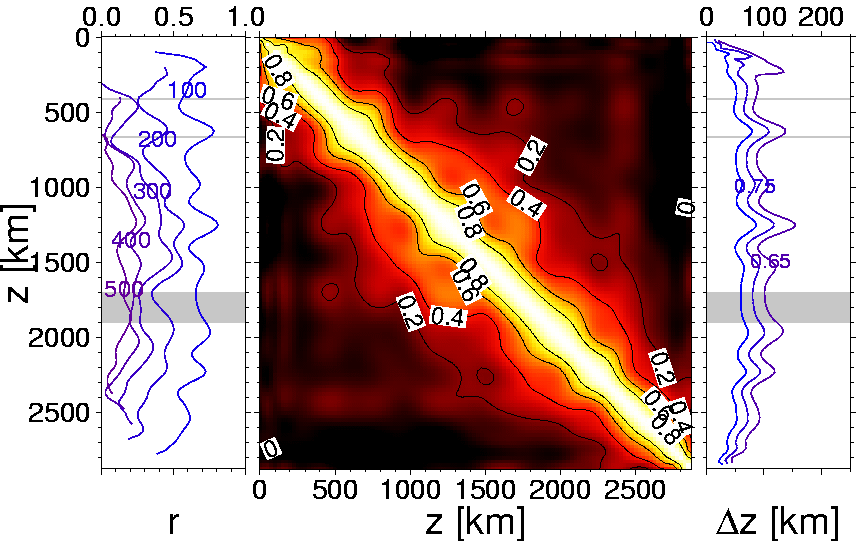
Radial correlation between different layers of model stb00d, Chebyshev reparameterization
Radial correlation matrix (mid plot), x and y axis indicate the depth levels for which the total linear correlation is calculated.
Contour invervals are 0.2. The left plot shows r for constant
depth bracket half-widths of from 100 km to 500 km as a function of mid-bracket depth.
The right hand plot shows Delta z, the corresponding depth bracket width of contourlines of r of 0.85, 0.75, 0.65 if we were able to track a continuous contour.
The model was reparameterized radially on Chebyshev polynomials of order 20,
the average variance reduction with respect to the original model coeffficients was
91.42%.
Note that some models suffer from ringing (over-fitting) toward the boundaries, this should not be interpreted as real structure.


view radial correlation for stb00d based on original parameterization
view Chebyshev based radial correlation for
pmean
hwe97p
kh00p
bdp98
bdp00
pb10l18
smean
grand
ngrand
s20rts
saw24b16
sb10l18
sb4l18
s20a
s362d1
rum
lrr98d
stb00d
view normalized power per degree for model stb00d or
power per degree for model stb00d
compare model stb00d with
pmean
hwe97p
kh00p
bdp98
bdp00
pb10l18
smean
grand
ngrand
s20rts
saw24b16
sb10l18
sb4l18
s20a
s362d1
rum
lrr98d
back to the model comparison page
(C) Thorsten Becker, Harvard University, 2001


