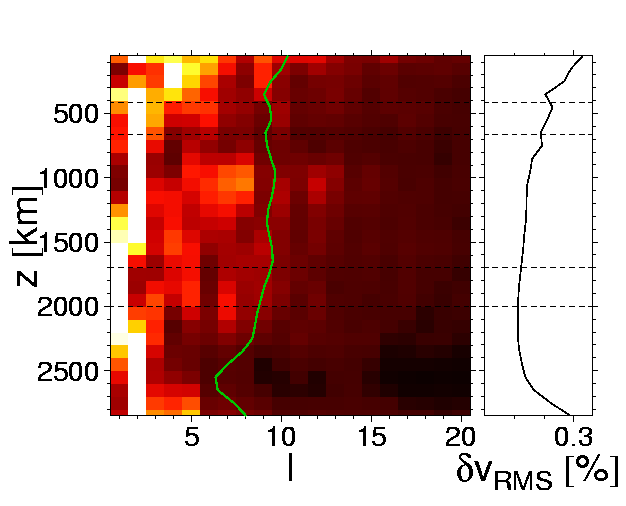
Normalized power per degree and unit area for model hwe97p
Power per degree l and unit area for model hwe97p normalized by the maximum power at each depth (left plot).
Curve indicates "center of gravity", ie. the first moment of the power distribution
at each depth. Depths of 410 km, 660 km, 1700 km, and 2000 km indicated by dashed lines.
Right plot shows RMS variations in model with depth.
view absolute power per degree for model hwe97p
view radial correlation of model hwe97p
view normalized power per degree for model
pmean
kh00p
bdp98
bdp00
pb10l18
smean
grand
ngrand
s20rts
saw24b16
sb10l18
sb4l18
s20a
s362d1
rum
lrr98d
stb00d
compare model hwe97p with
pmean
kh00p
bdp98
bdp00
pb10l18
smean
grand
ngrand
s20rts
saw24b16
sb10l18
sb4l18
s20a
s362d1
rum
lrr98d
stb00d
back to the model comparison page
(C) Thorsten Becker, Harvard University, 2001