THORSTEN W. BECKER
Department of Earth Sciences
University of Southern California
Los Angeles

Western US tomography plotter


[news] [research] [teaching] [publications] [group] [CV] [downloads] [contact]
downloads: [software] [tomography] [visualizations] [global maps] [SKS]
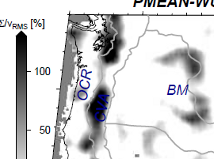
The tool below can make maps for tomographic models SH11 (Schmandt & Humphreys, 2010, 2011), MIT-P (Burdick et al., 2008, 2010), DNA09/10 (Obrebski et al., 2010, 2011), NWUS (James et al., 2011), SFTS11 (Sigloch et al.,2008; Sigloch, 2011), TX2008 (Simmons et al., 2007), and MEAN-WUS (Becker, 2012), as discussed and properly referenced in
  • Becker, T. W.: On recent seismic tomography for the western United States. Geochem., Geophys., Geosys., 13,, Q01W10, doi:10.1029/2011GC003977, 2012. (PDF).
To generate a new plot: Select a model from the dropdown menu, select a depth (via slider or text box), and click "plot" to generate a new figure. The HTML interface was coded up by J. Yu (USC) and calls a GMT (Wessel & Smith, 1998) batch script that will linearly interpolate between depth layers within the original bounds (typically within 50 to 1000 km). If outside those depths, no plot will be produced. Note links to PDF and PS version of the PNG image displayed below.
Major geographic features are noted (BM, Blue Mountains; CCR, California Coastal Ranges; cGB, central Great Basin; CP, Colorado Plateau, CS, Carson Sink; CVA, Cascade Volcanic Arc; GV, Great Valley; OCR, Oregon Coastal Ranges; SD, Sevier Depression; SN, Sierra Nevada; ST, Salton Trough; TMC, Timber Mountain Caldera; TR, Transverse Ranges; WF, Wasatch Front; WL, Walker Lane; YS, Yellowstone) along with major morphological provinces.

[news] [research] [teaching] [publications] [group] [CV] [downloads] [contact]
downloads: [software] [tomography] [visualizations] [global maps] [SKS]
Updated: November 20, 2011. (c) USC Geodynamics