|
Thorsten Becker
The University of Texas at Austin Global plate tectonic maps |

|
[news] [research] [teaching] [team] [publications] [CV] [contact]
downloads:
[SKS compilation] [APM model] [LPO model]
[lecture notes] [papers]
These maps are produced with GMT, iGMT, and make use of a range of geophysical datasets as compiled within iGMT or the Unified Geodynamics Earth Science Computing Environment (UGESCE), and may be useful for teaching or research. For information on how to make such maps and use GMT and iGMT, see my computing and Earth science mapping teaching material and the Unified Geodynamics Earth Science Computing Environment (UGESCE).
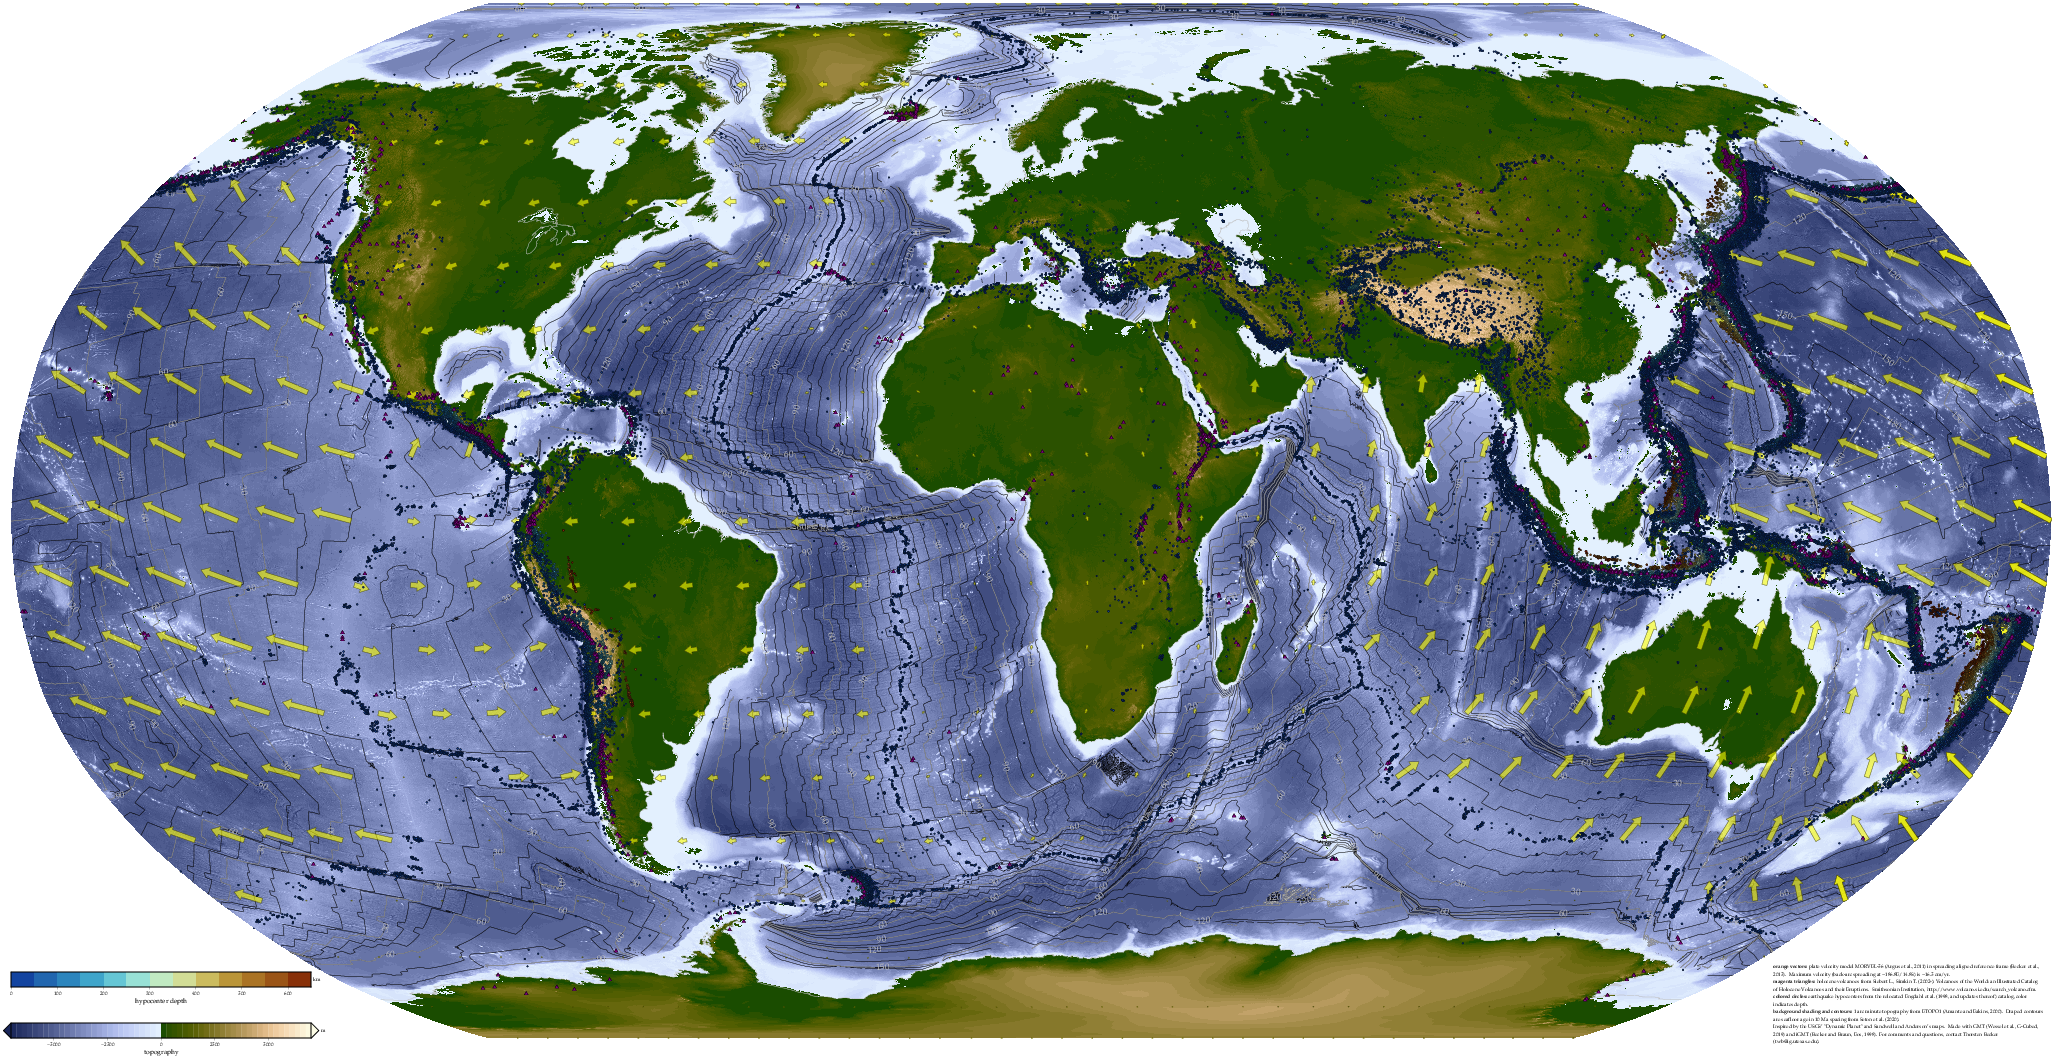
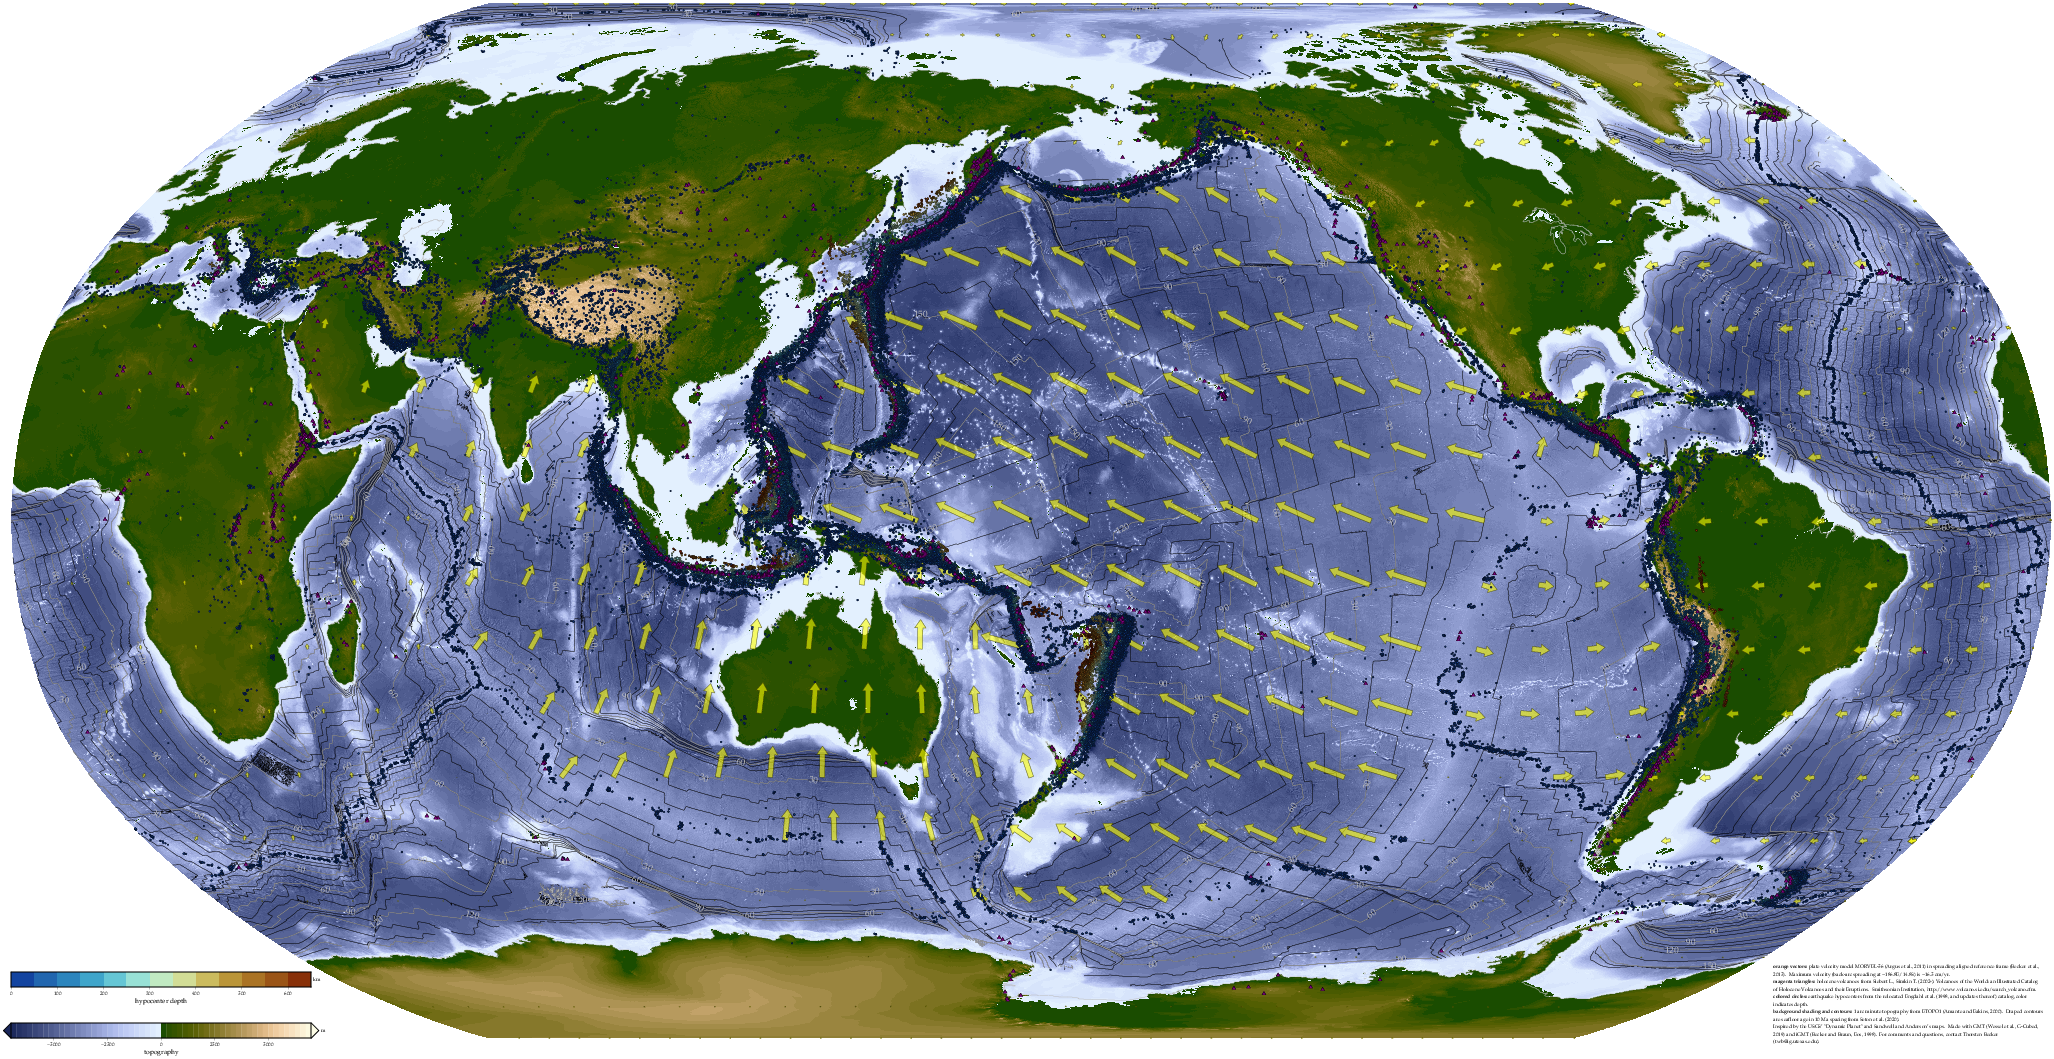
- Plate motions, ISC-GEM seismicity, and all gCMTs:
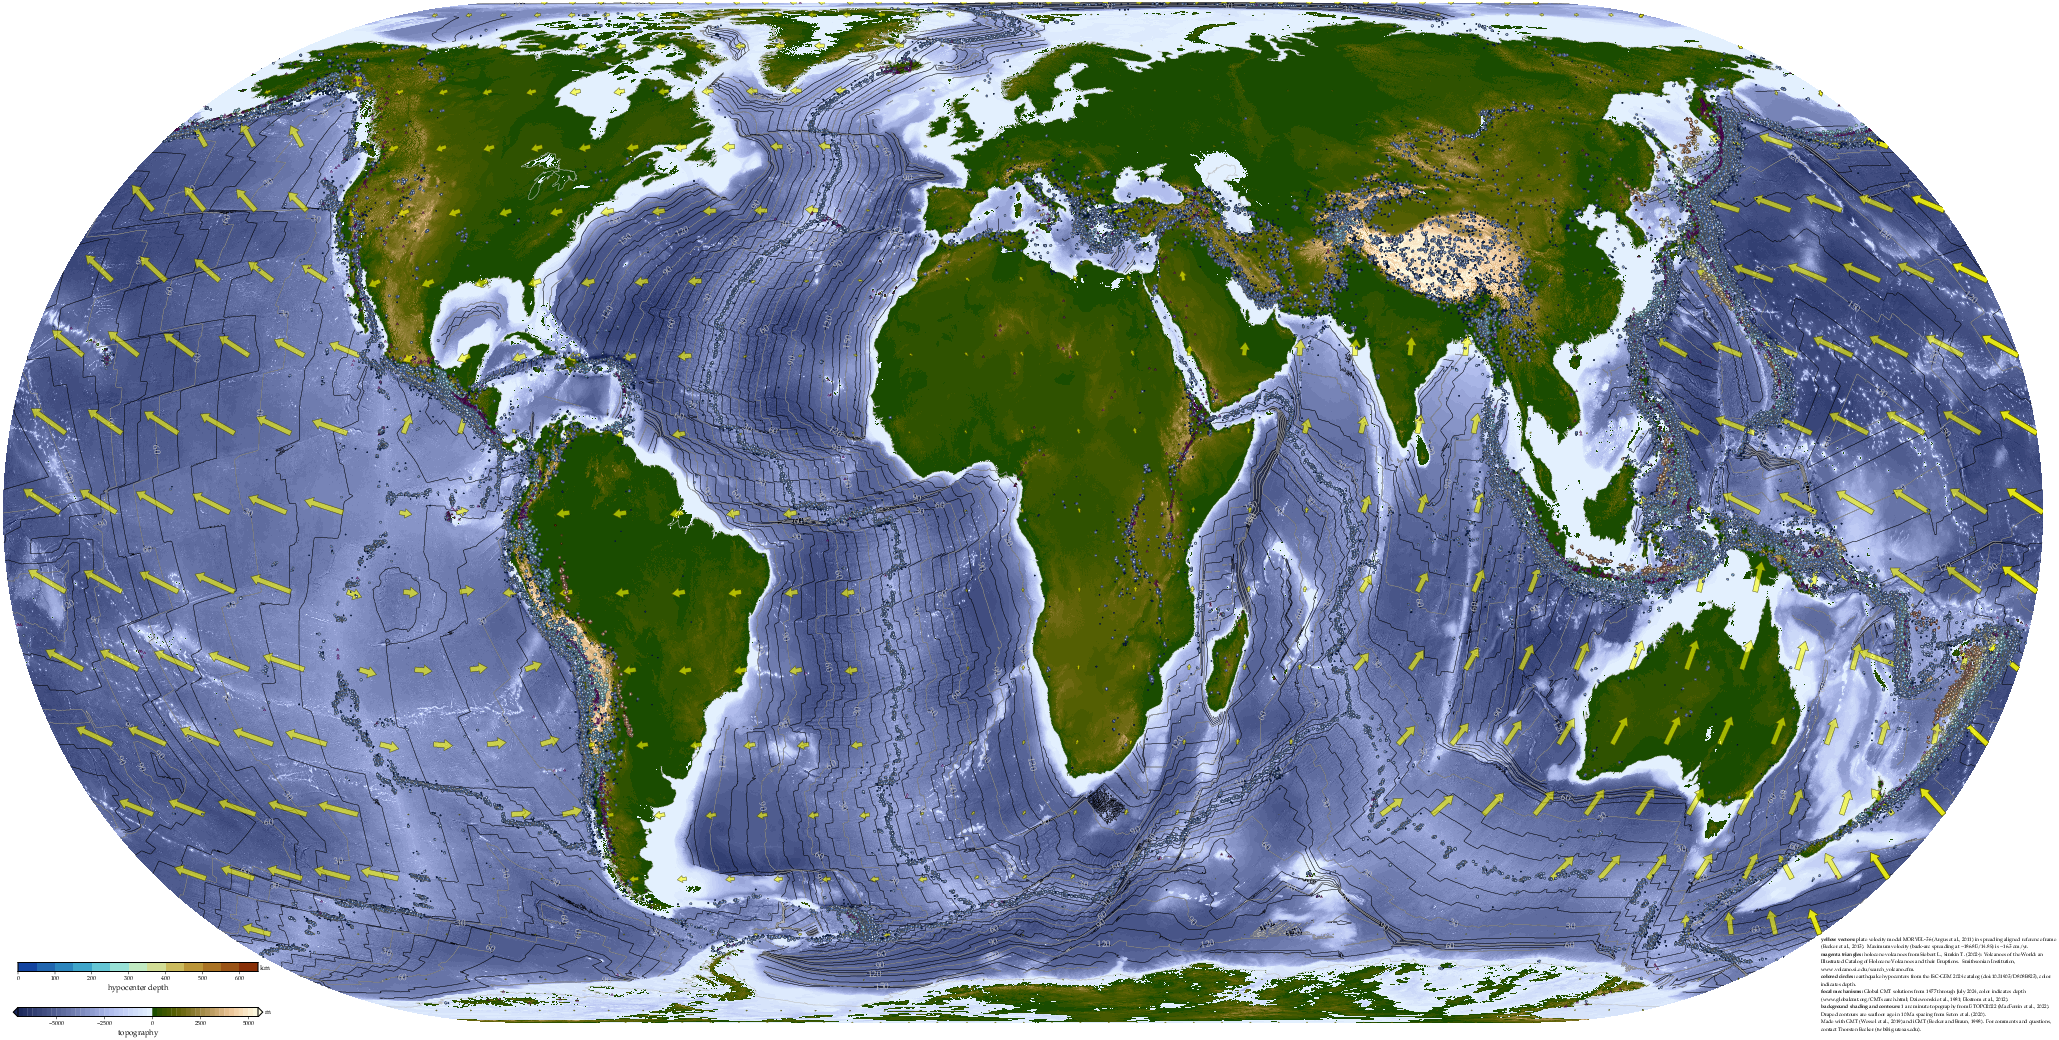
[PDF] [PNG] [PDF] [PNG]
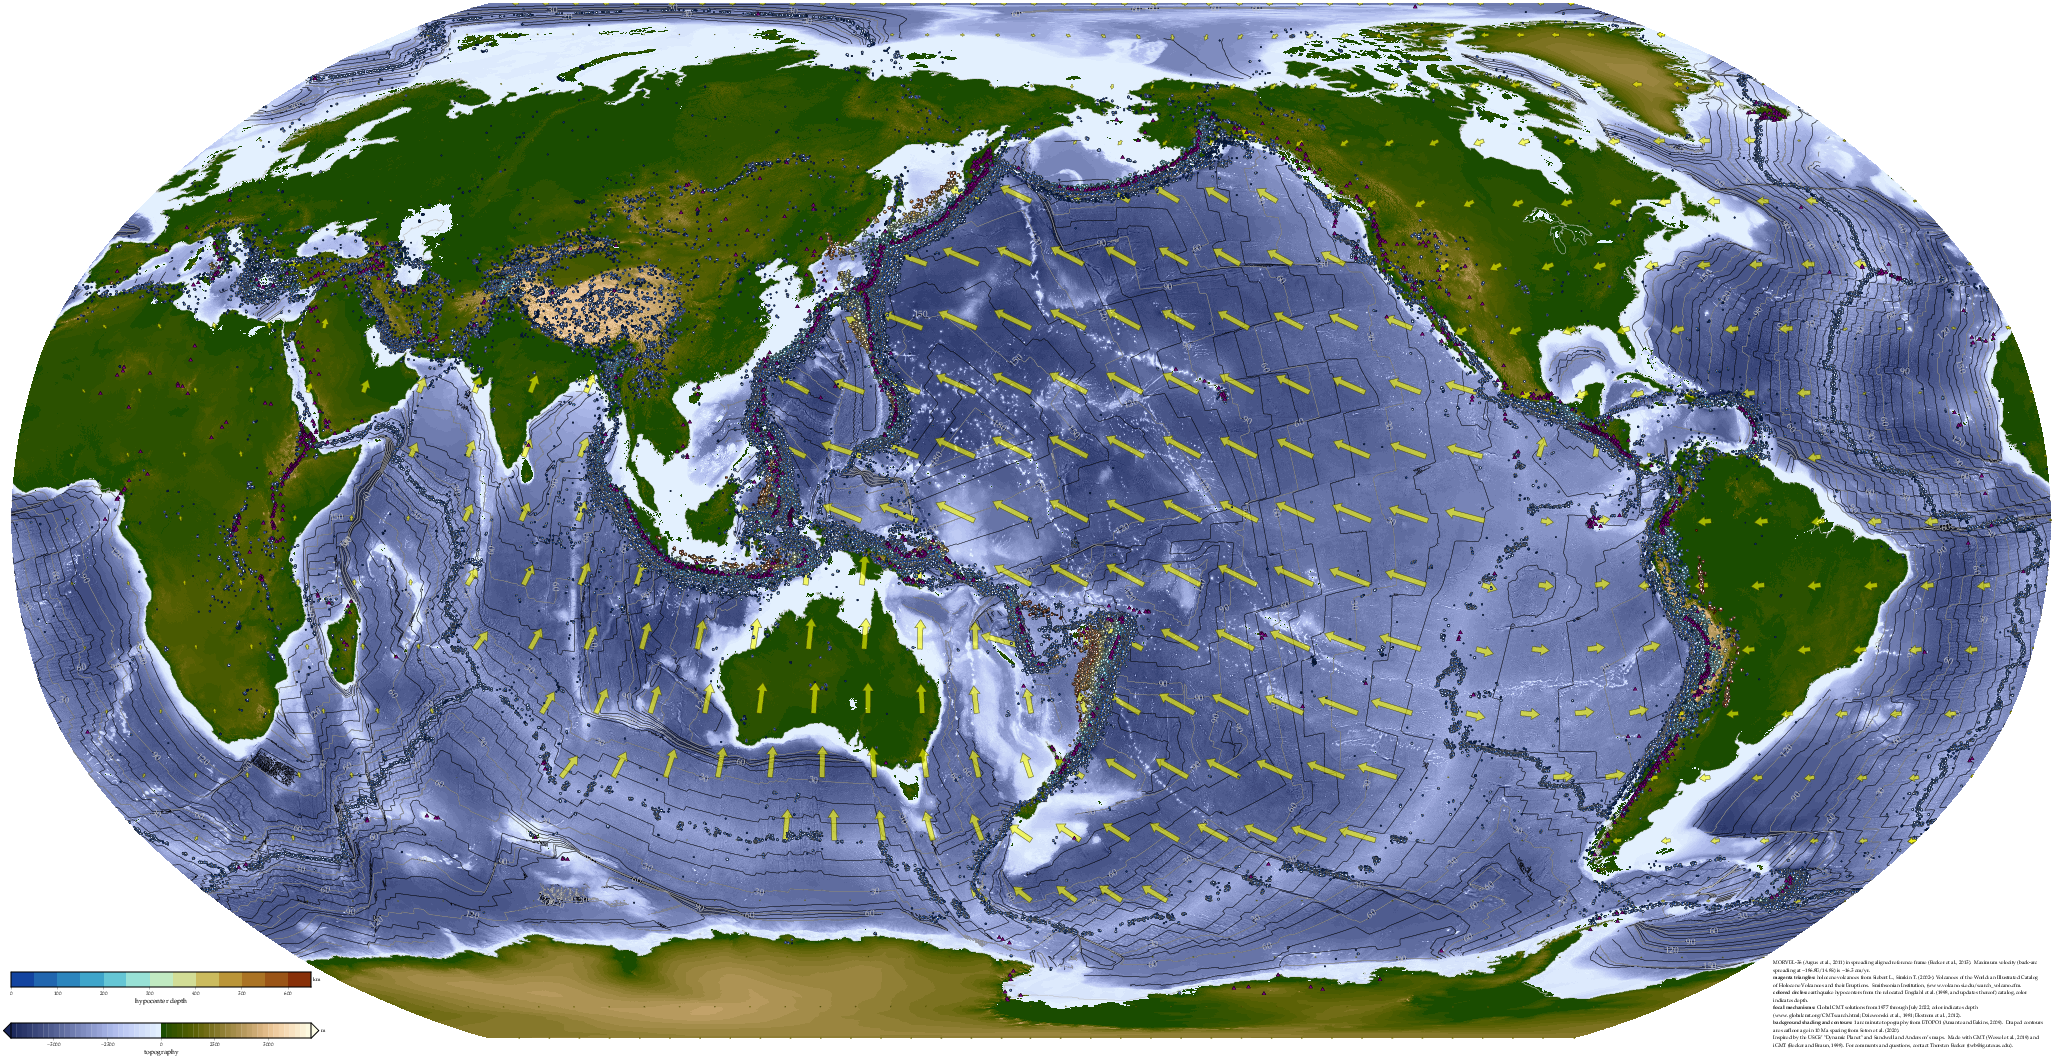
Download a PDF of the same map with map center on the Pacific or Africa. (With illumination/shading: download a PDF.) - Plate motions, shallow (< 50 km) seismicity and
gCMTs:
[PDF] [PNG] [PDF] [PNG]
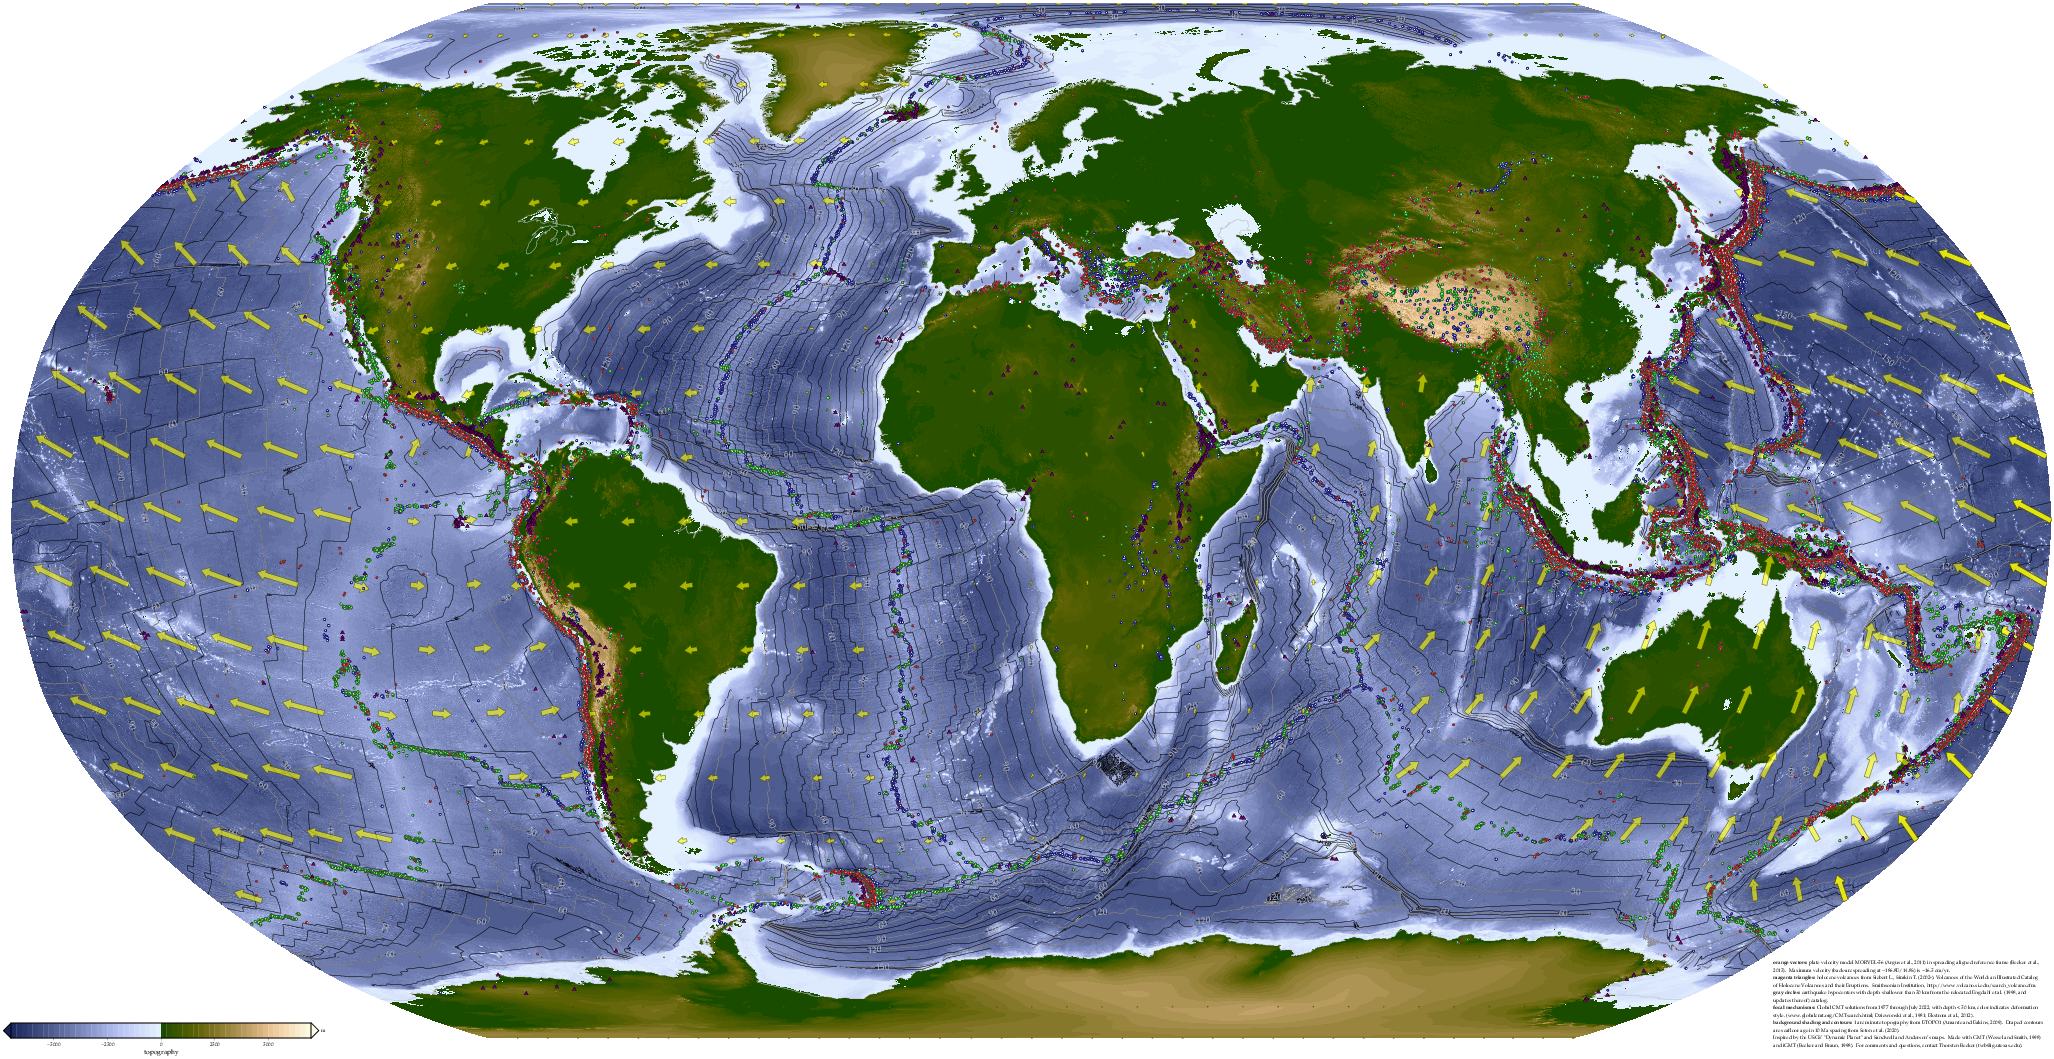
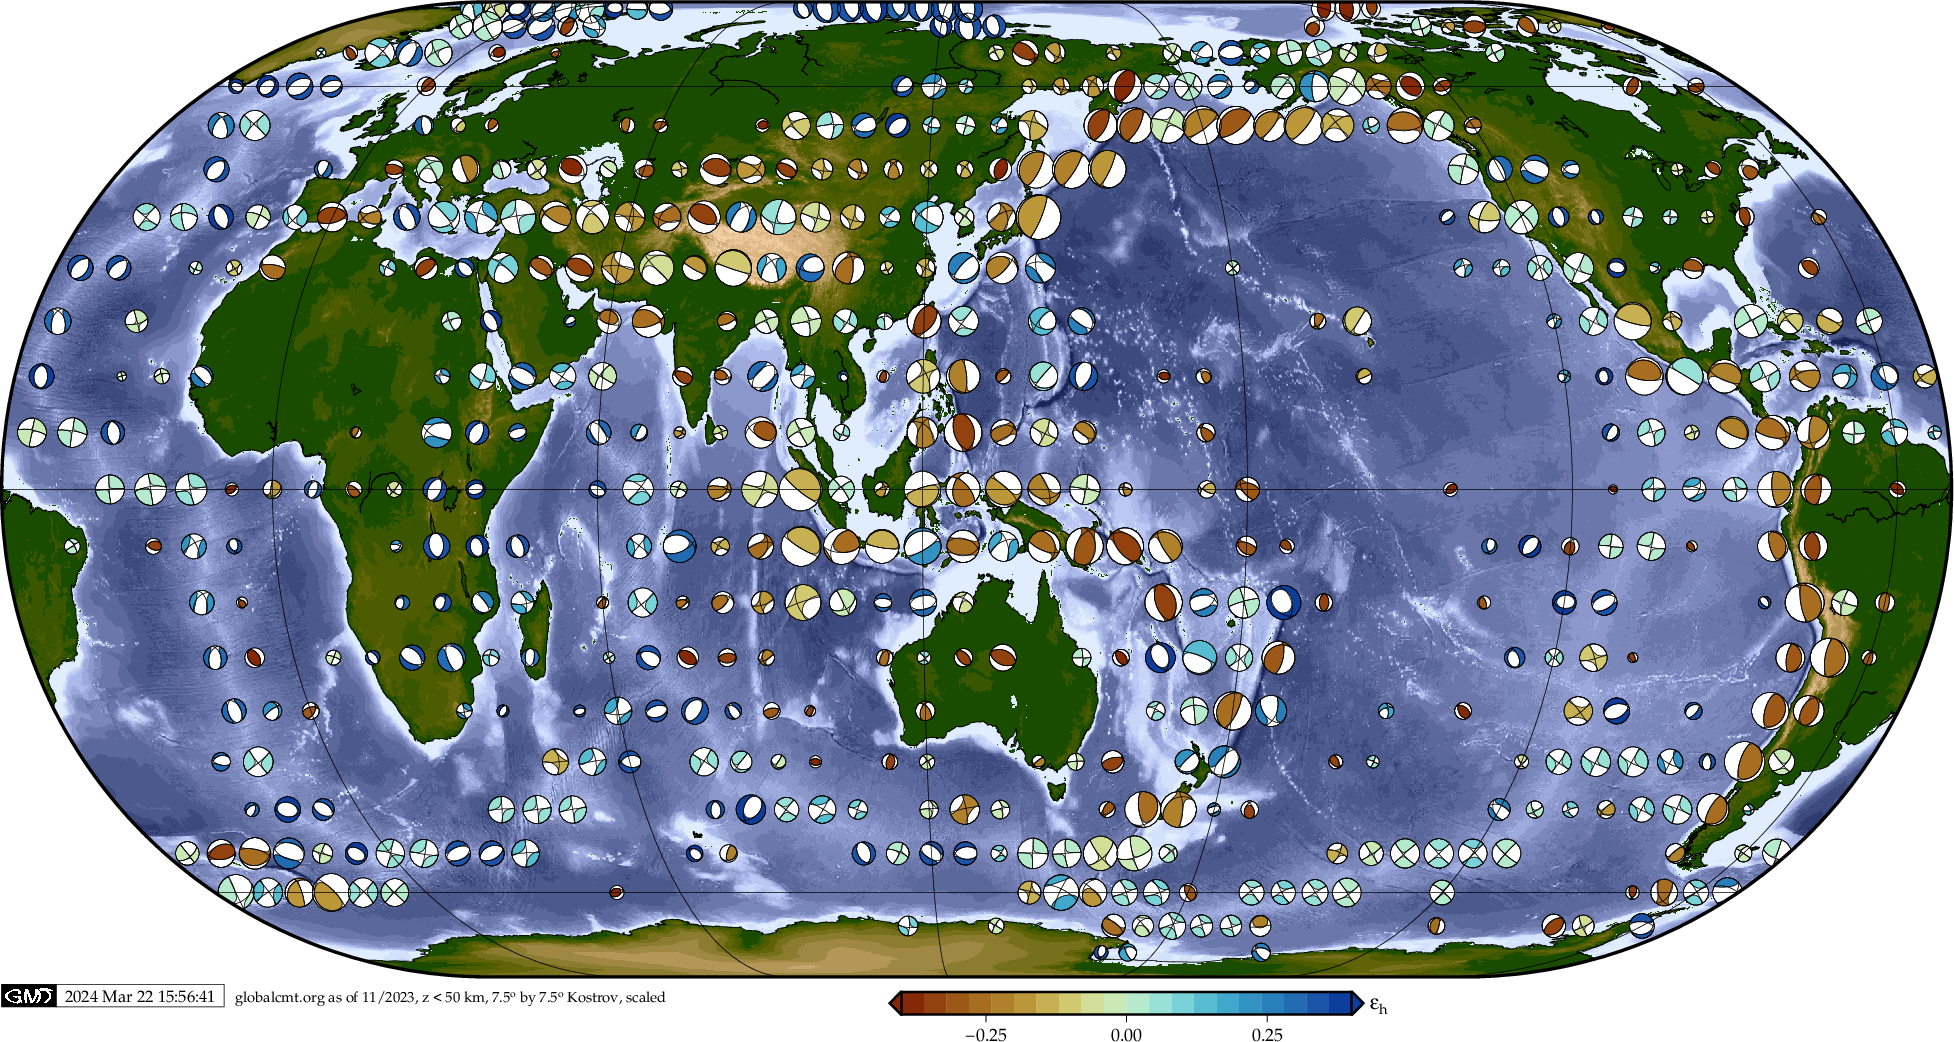
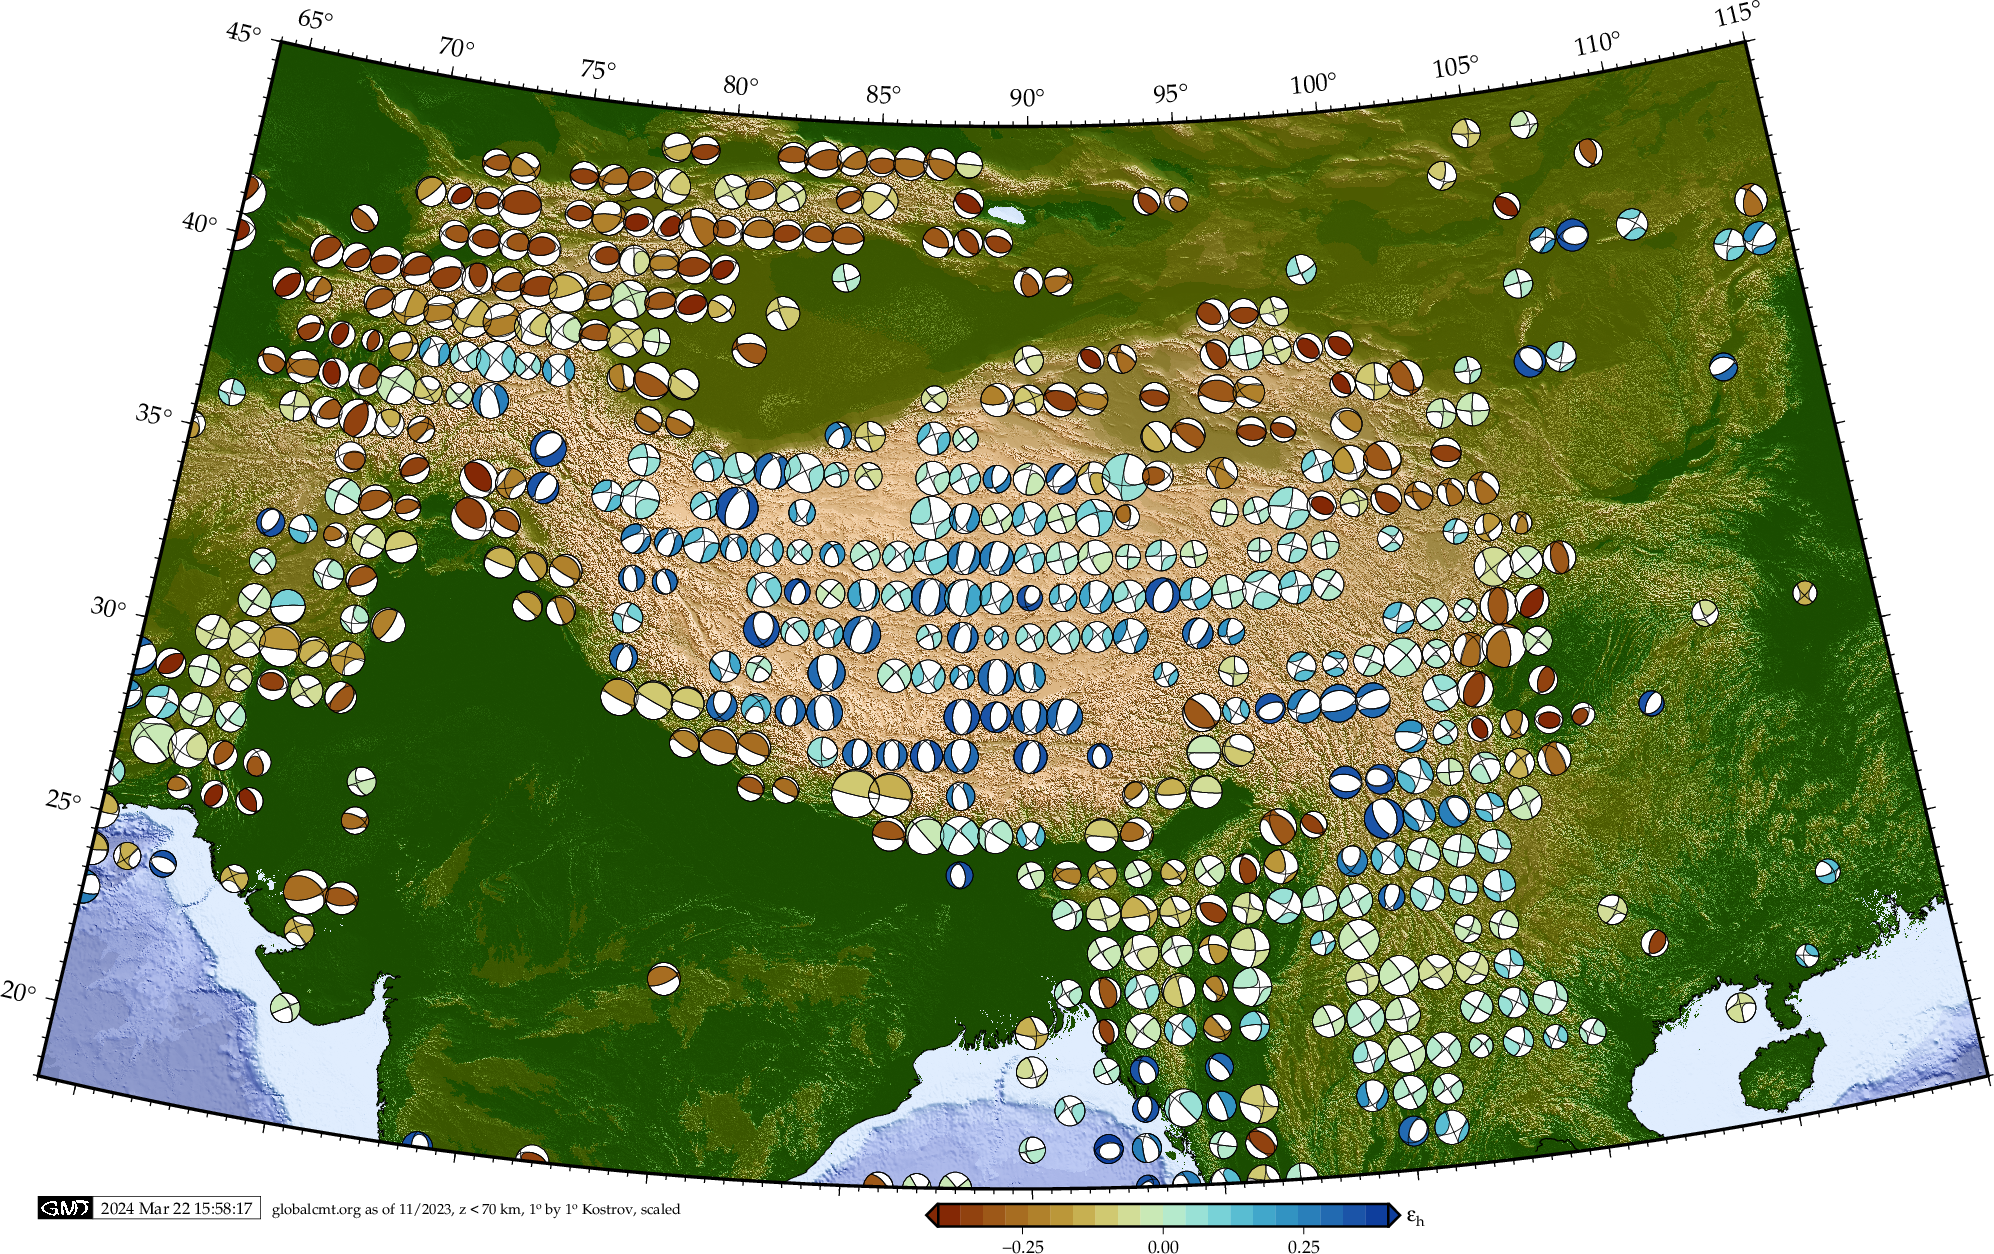
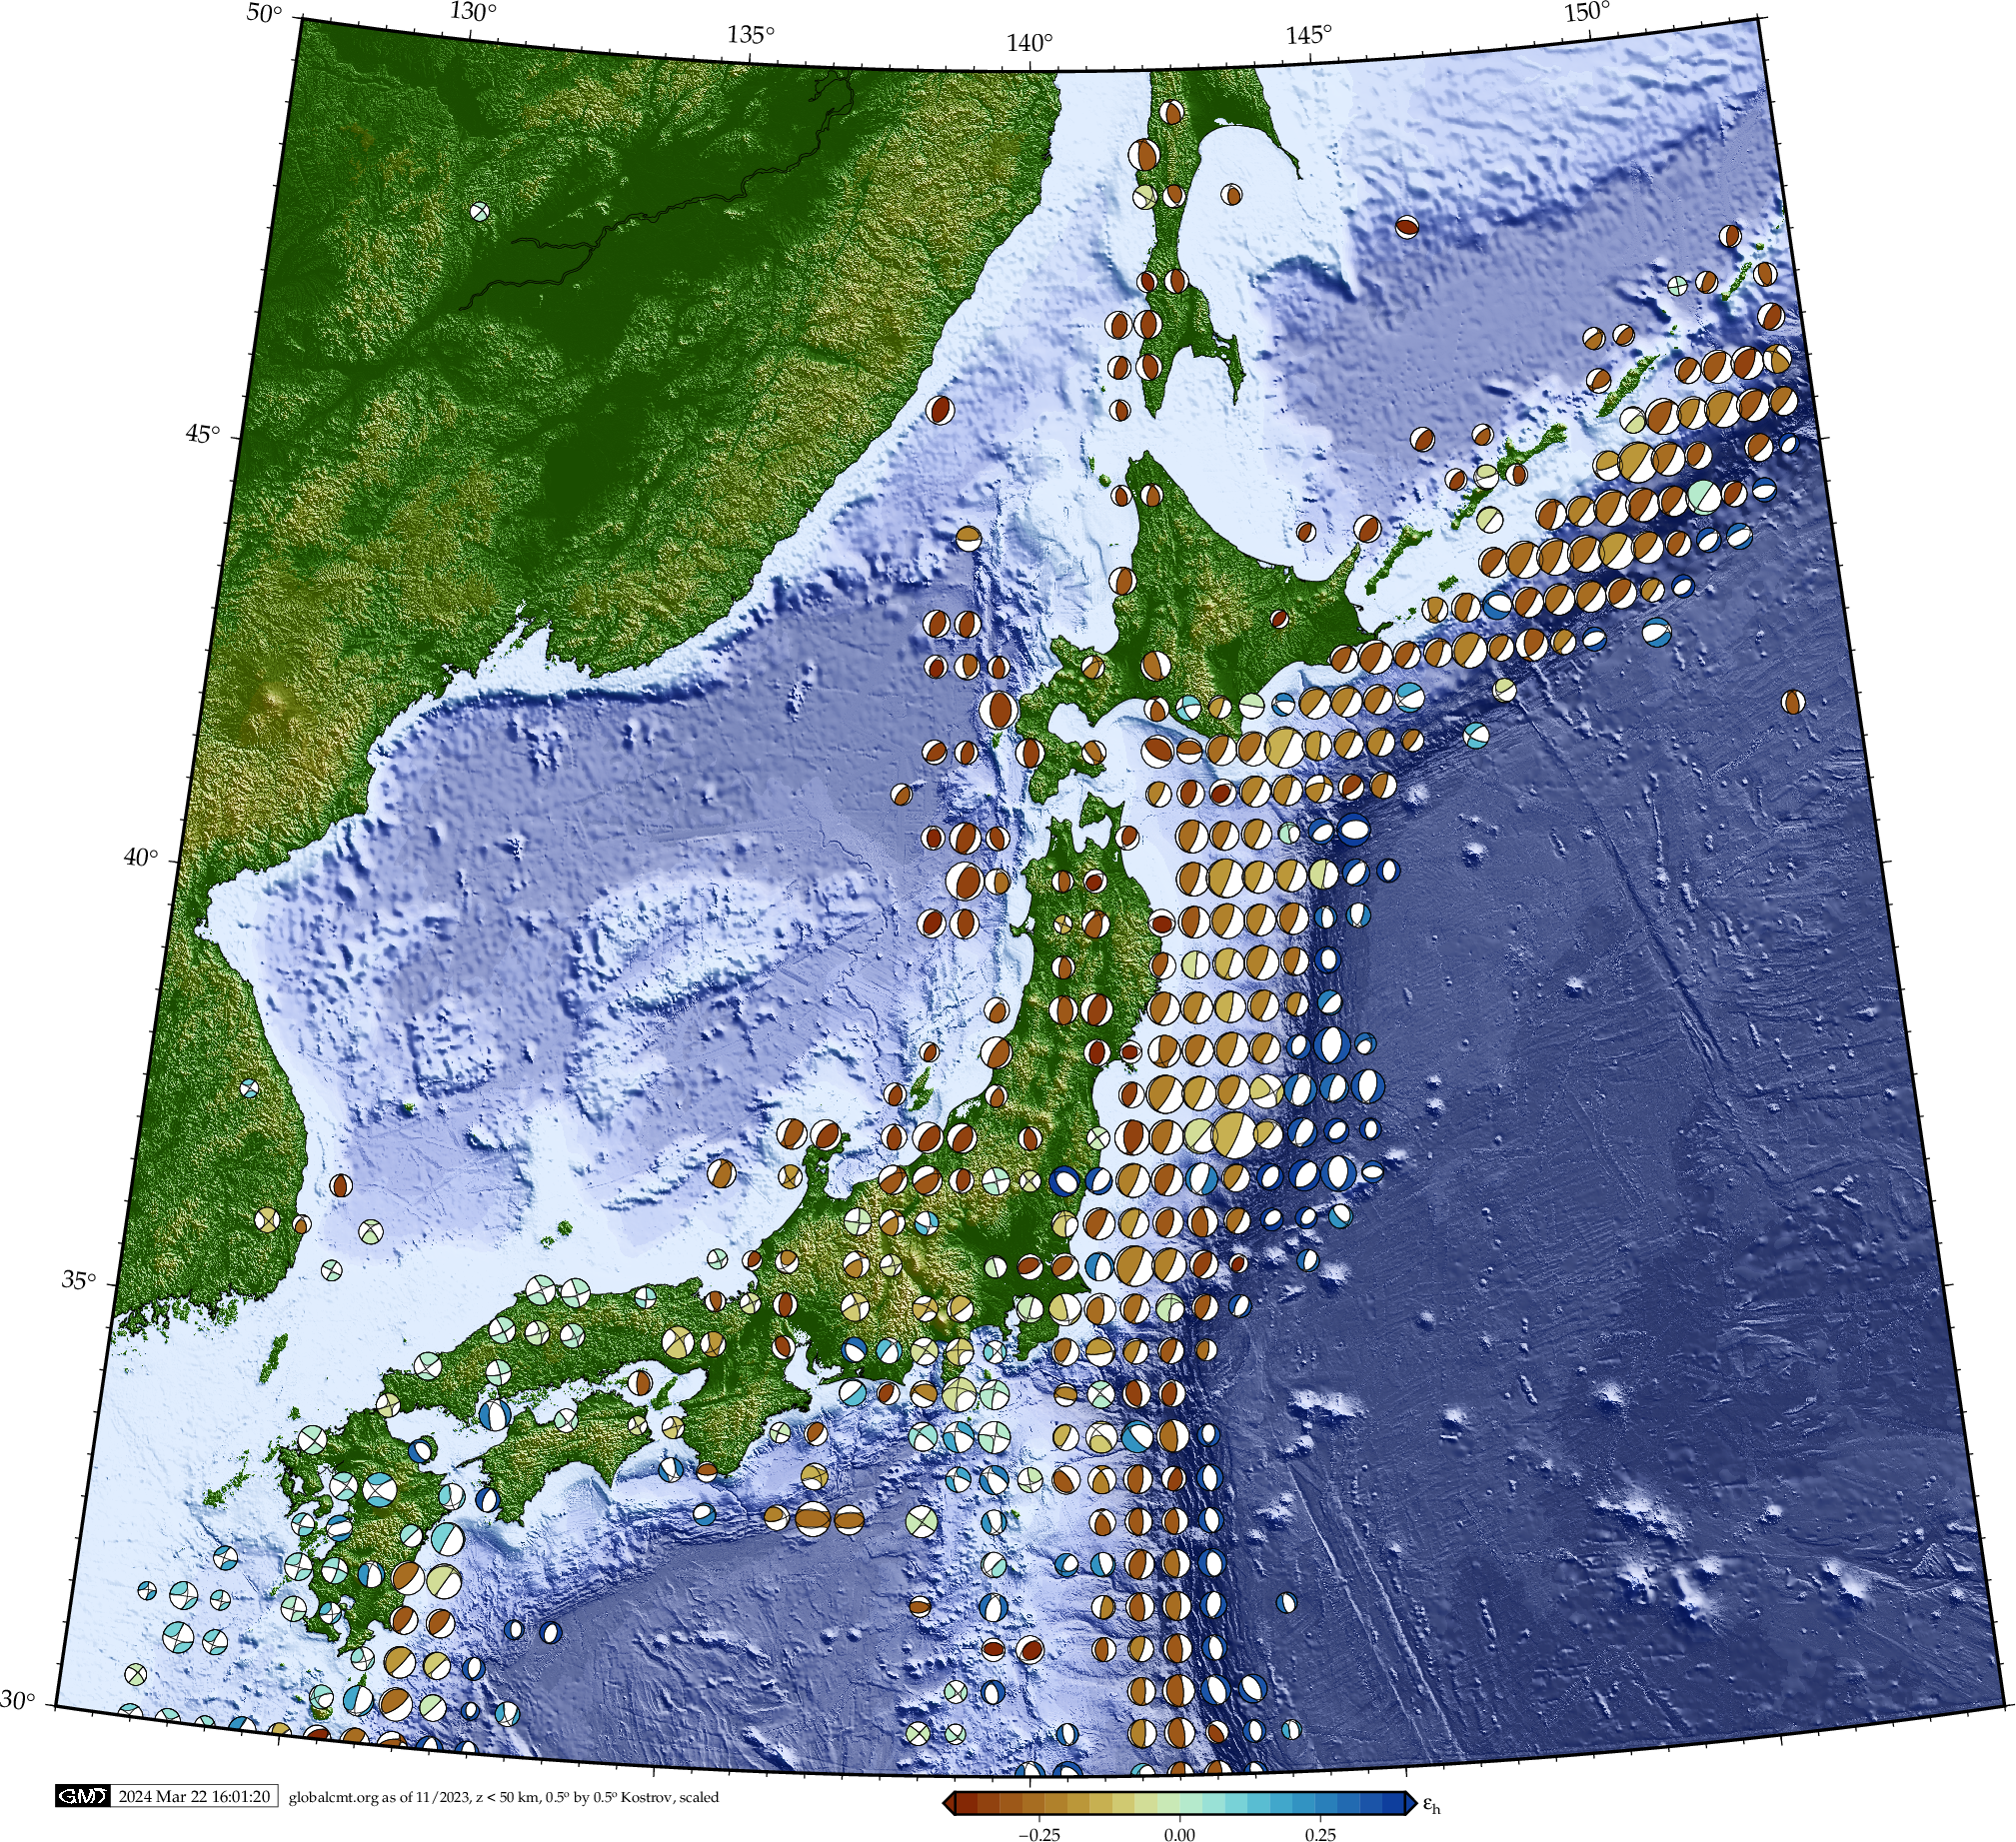
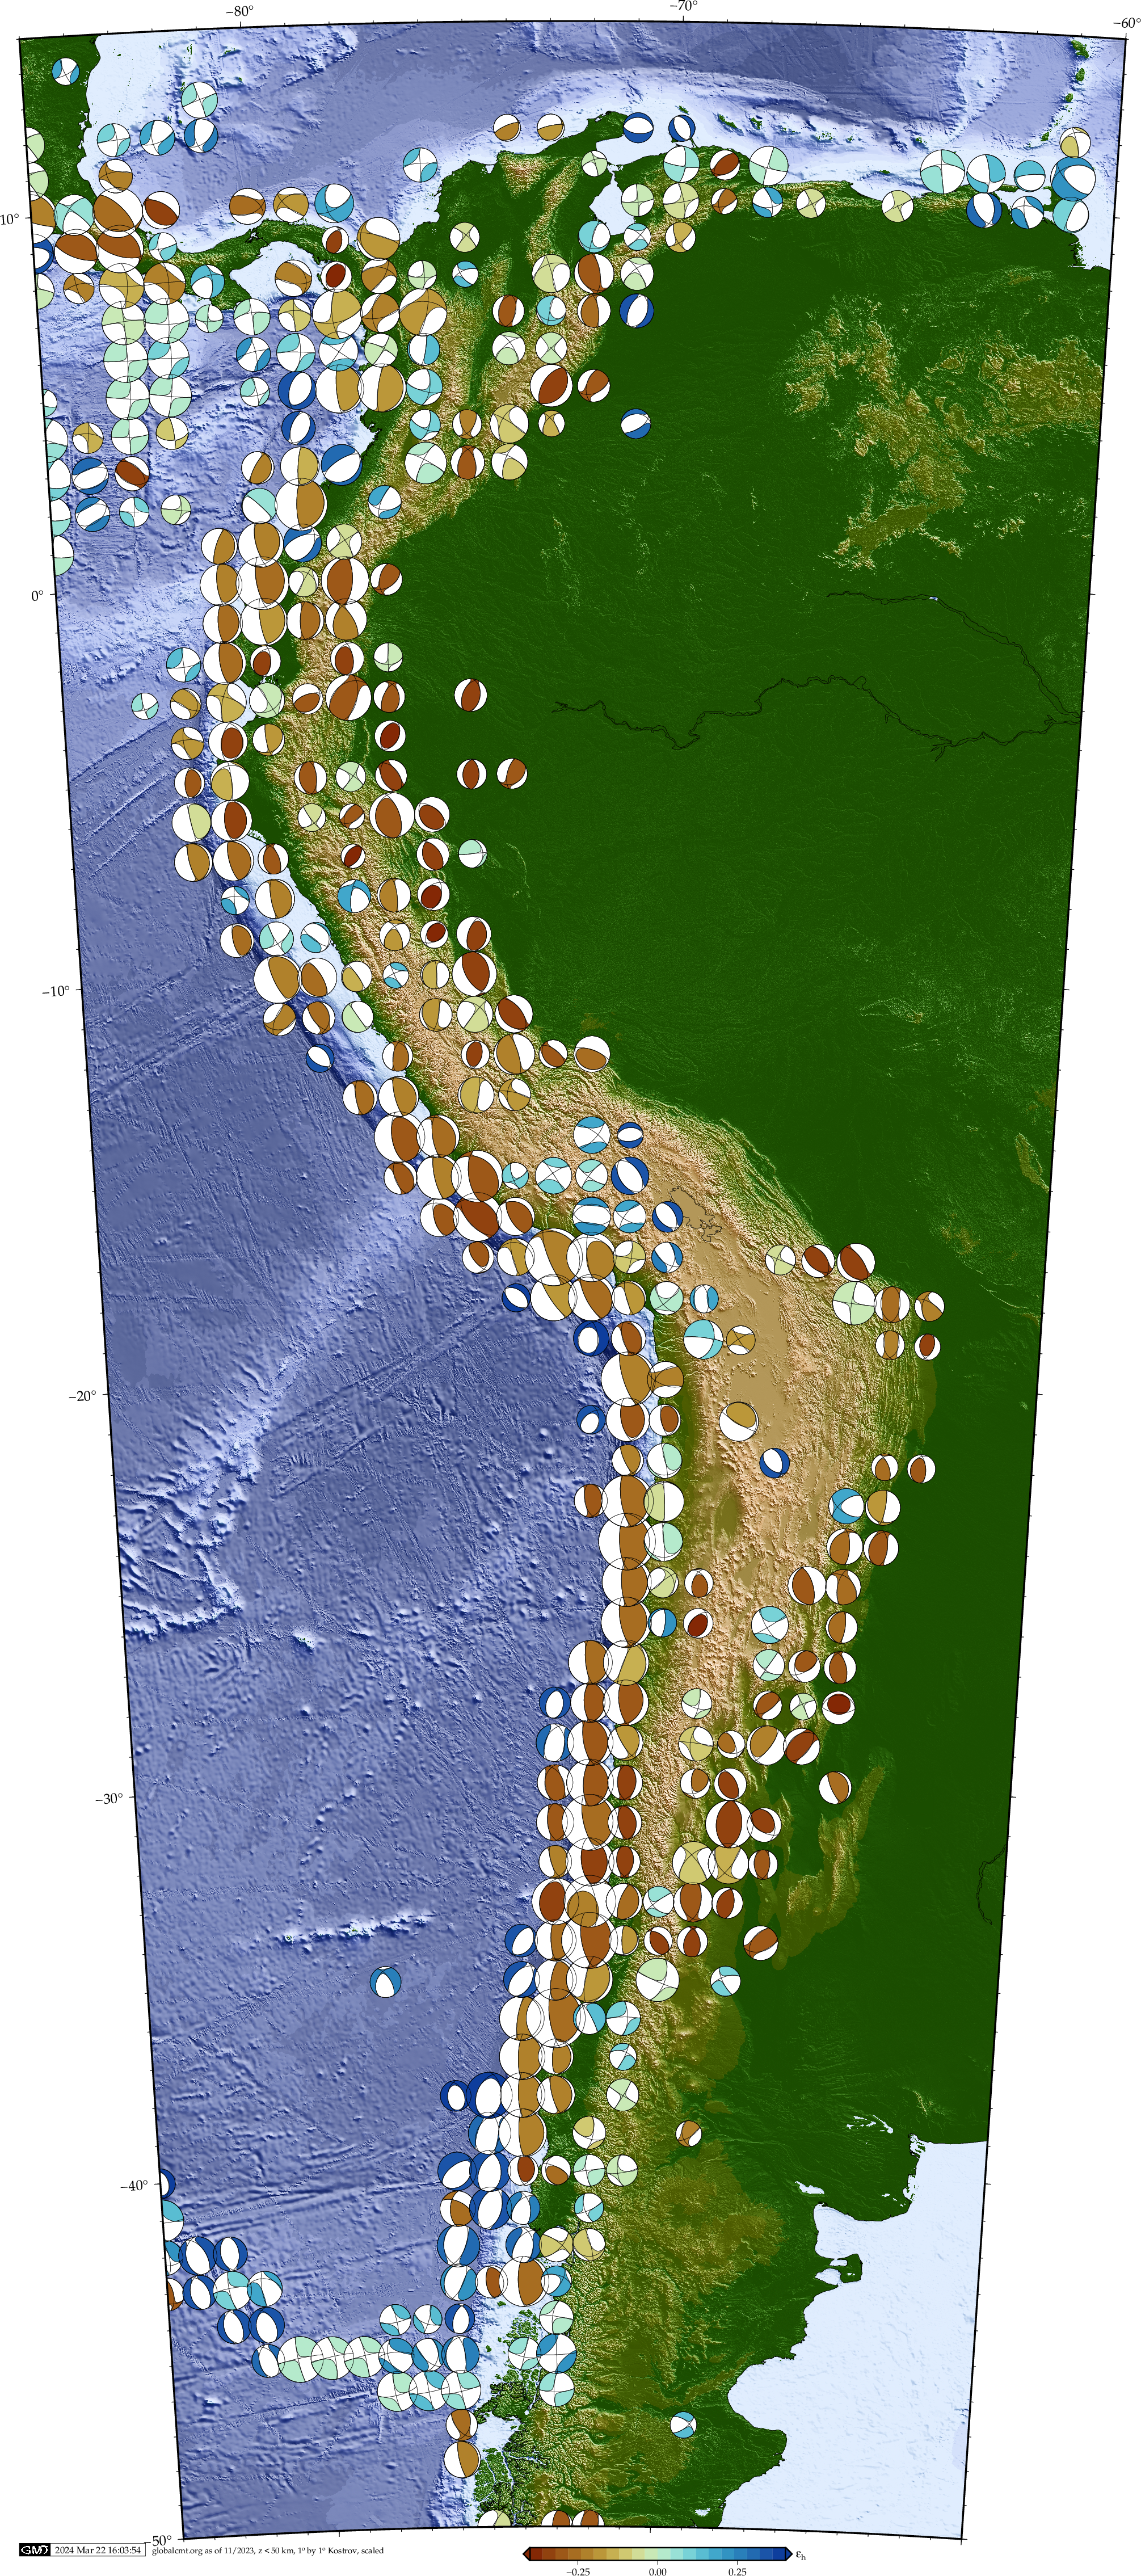
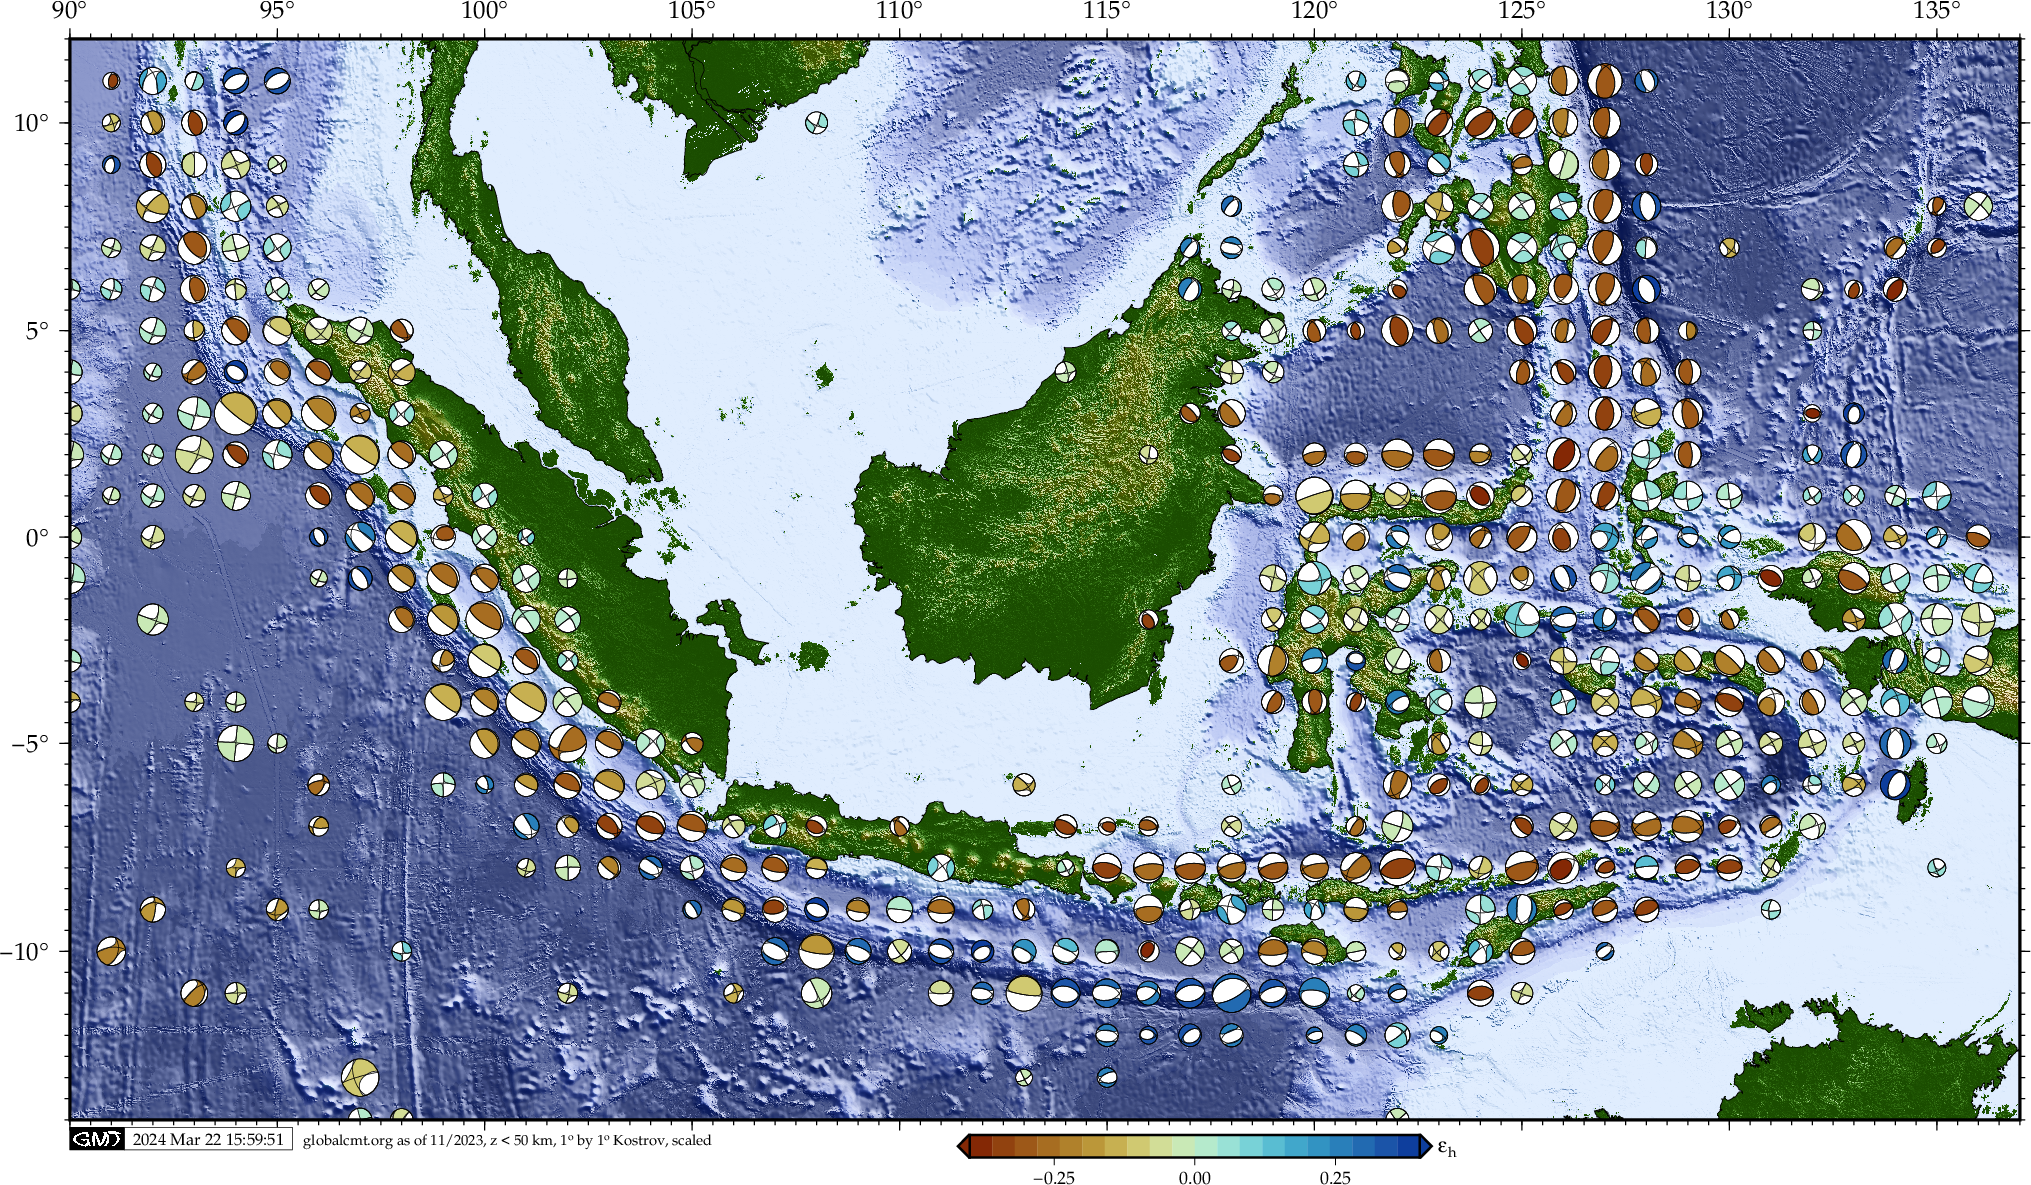
Download a PDF with map center on the Pacific or Africa. - Plate motions, lithospheric Kostrov summed coseismic strain (from
gCMTs < 50 km):
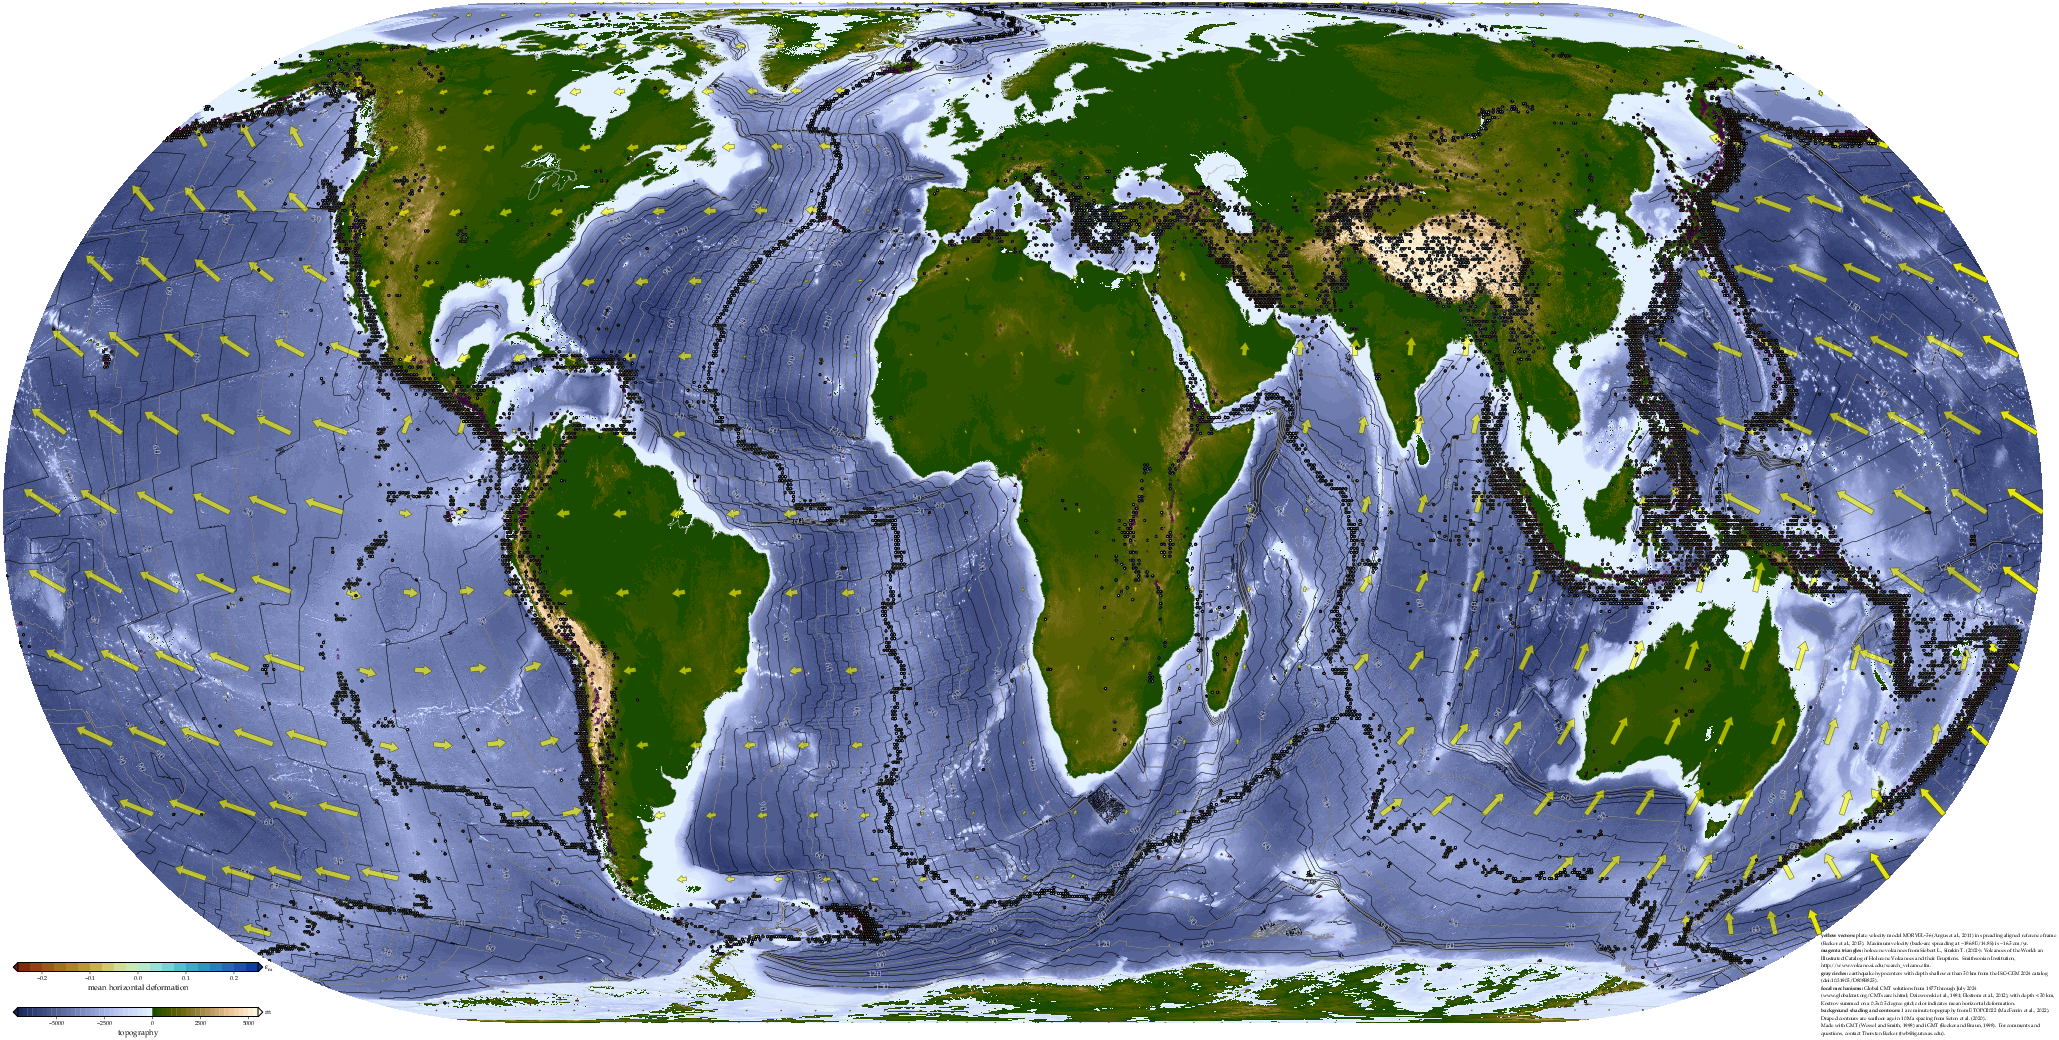
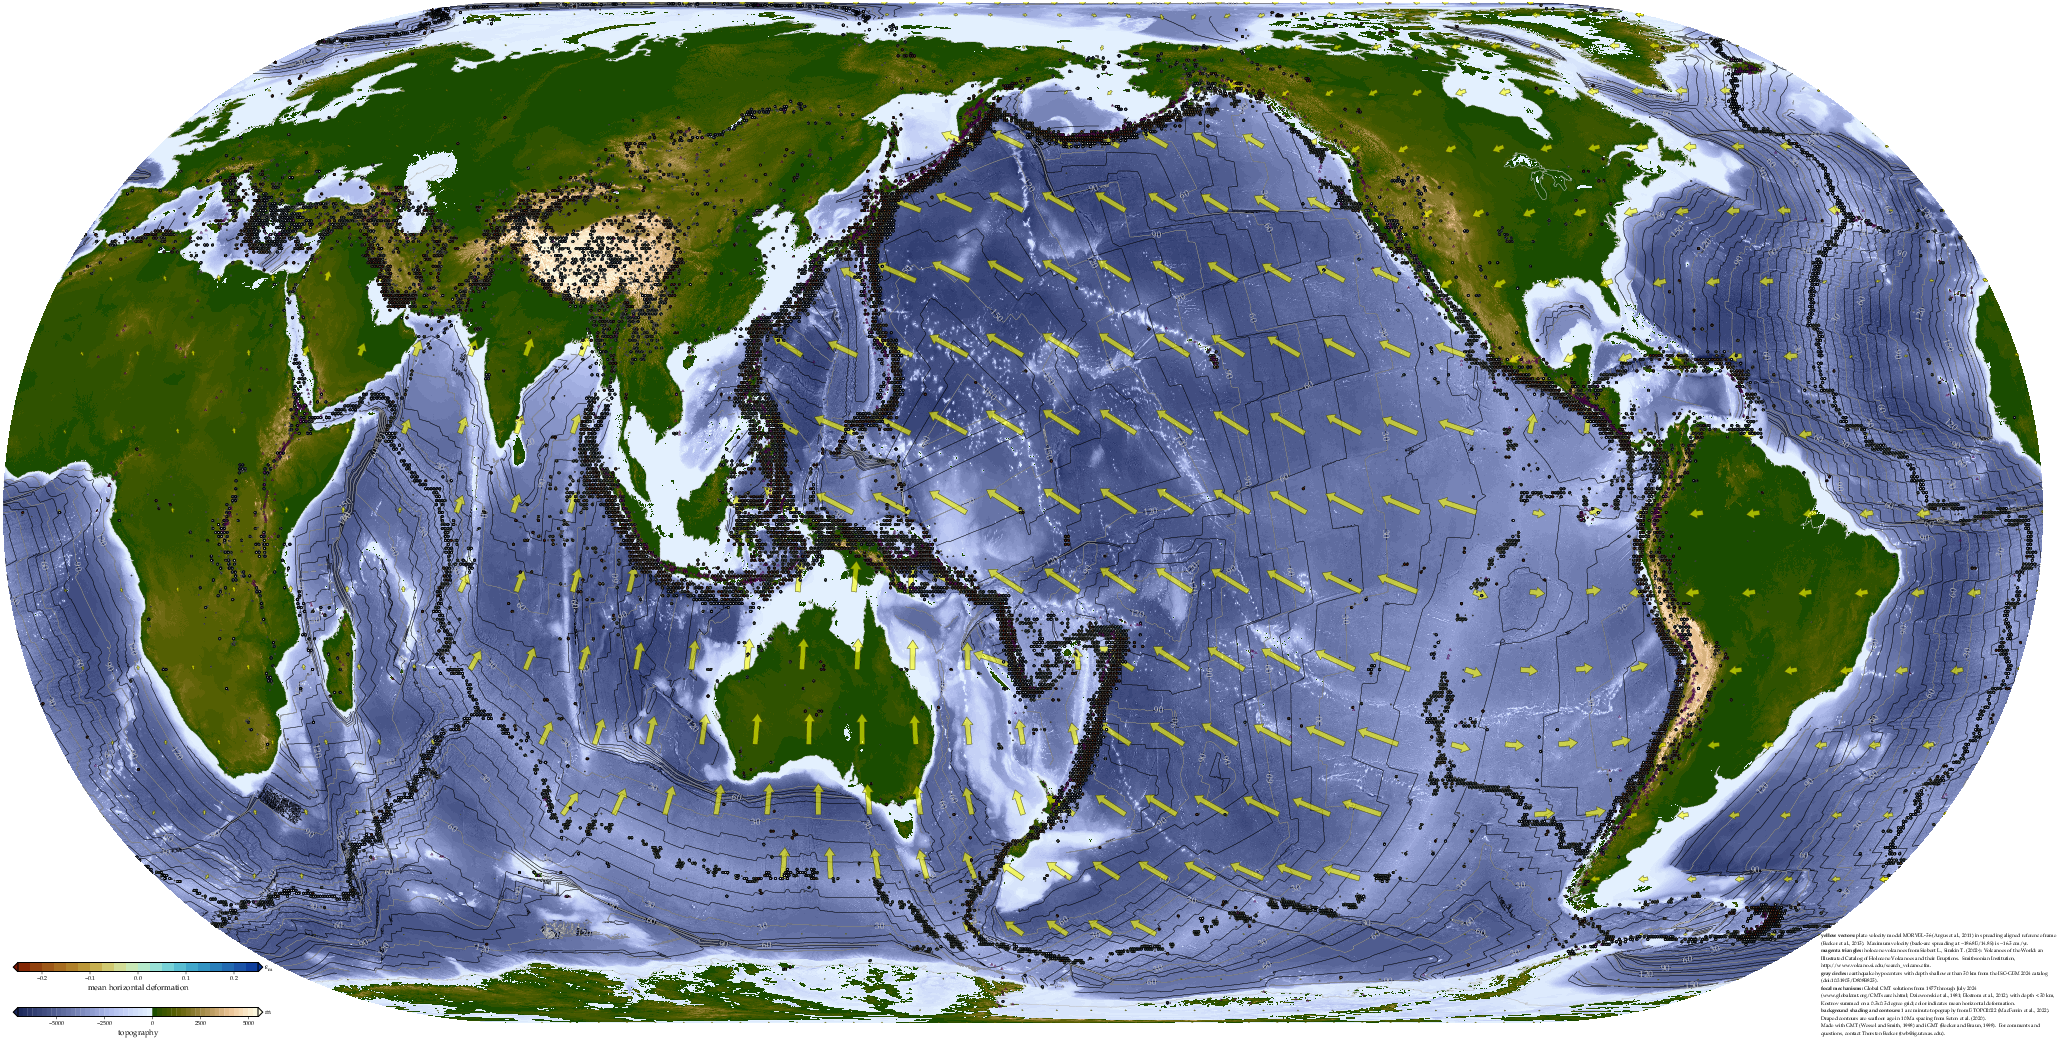
[PDF] [PNG] [PDF] [PNG]
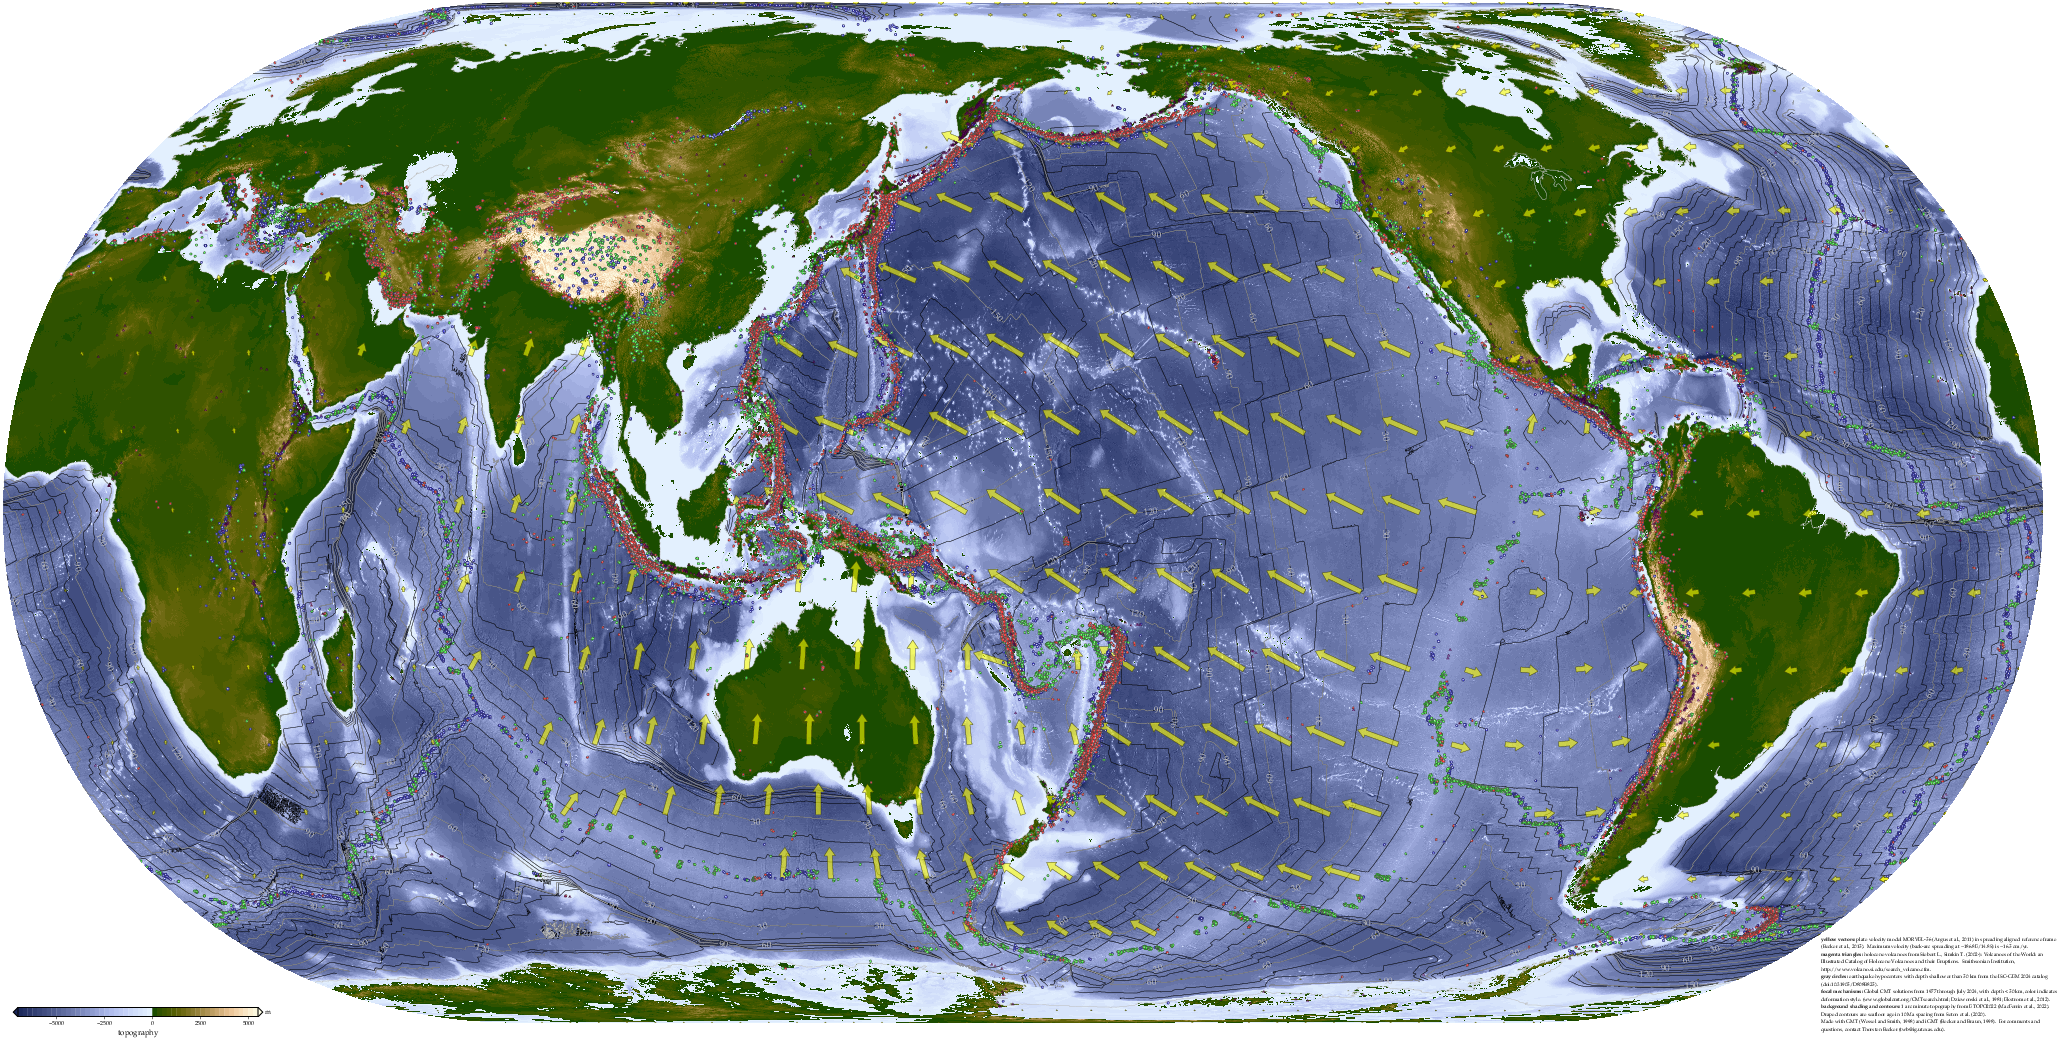
Download a PDF with map center on the Pacific or Africa. - Plate motions and seismicity:
[PDF] [PNG] [PDF] [PNG]
Download a PDF file, centered on the Pacific or Africa. (With illumination: PDF.)
The iGMT produced GMT scripts used to make these maps can be found by following this link to the data ftp directory.You might also want to check out a comparison of all the colormaps that come with GMT, as PDF files in their in their original spacing, or normalized to 0...1.
- Topography, plate boundaries, and subduction zone seismicity contour map:
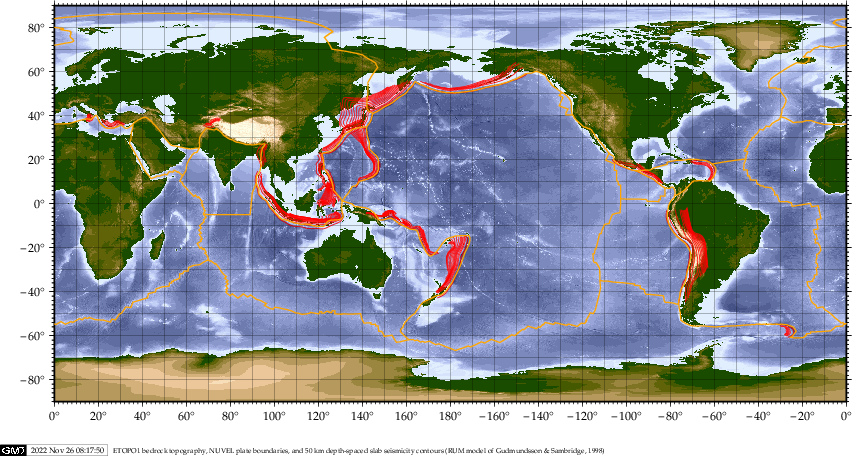
[PDF] [PNG]
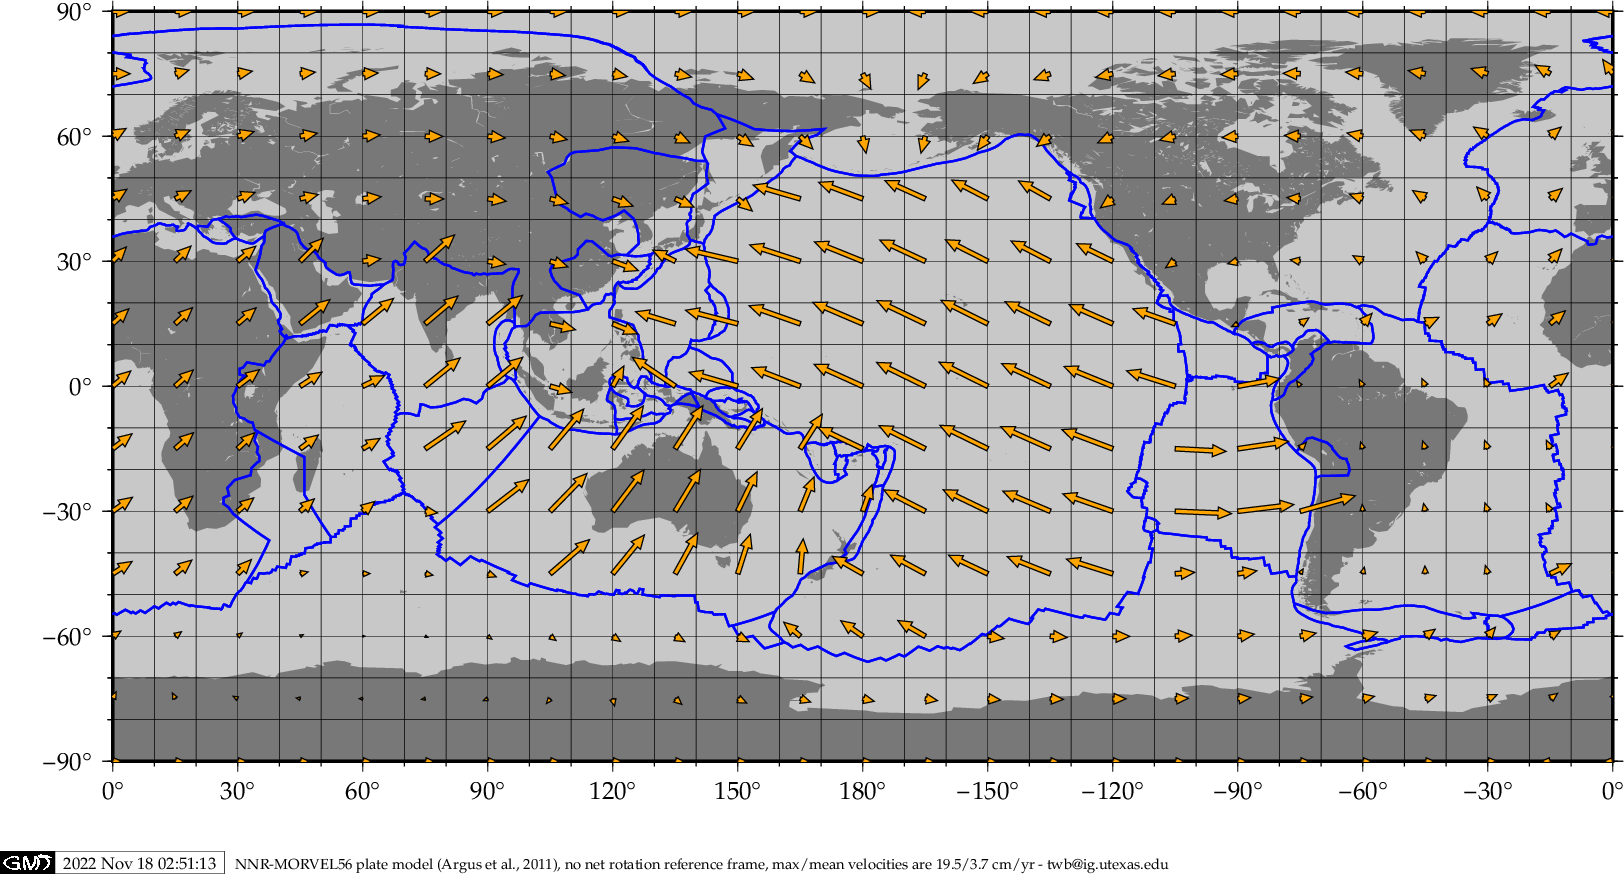
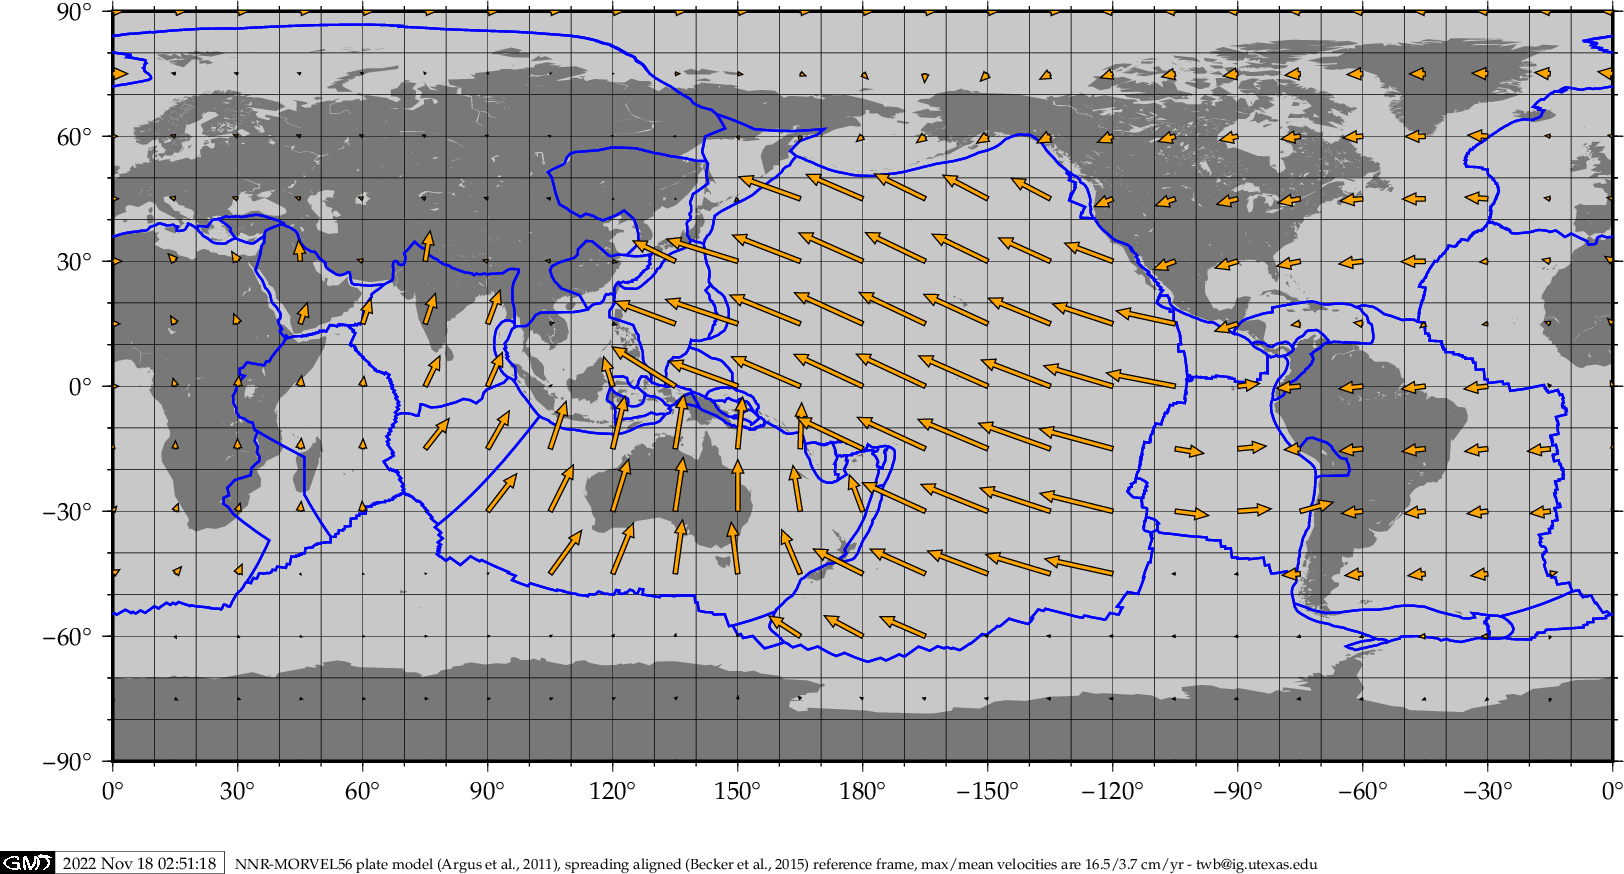
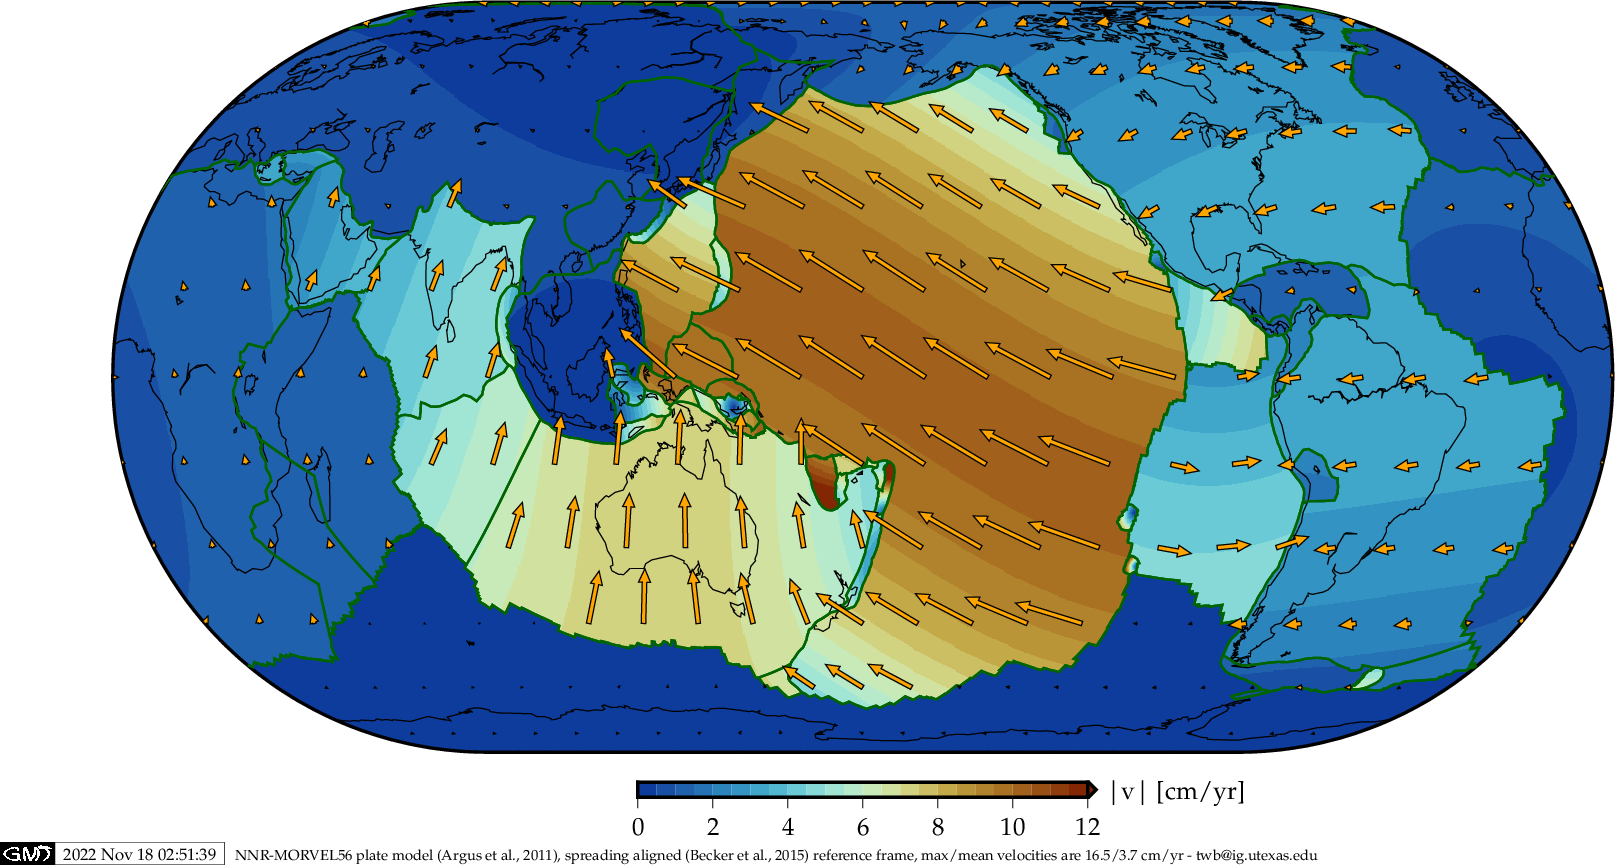
This map, on a non-projection projection, can be useful to find rough geographic coordiates, etc. Slab contours are from the Gudmundsson and Sambridge (1998) RUM model. - Simple plate tectonic map with plate velocities:
References:NUVEL-1A
(deMets et al., 1994)MORVEL-56
(Argus et al., 2011)No net rotation reference frame 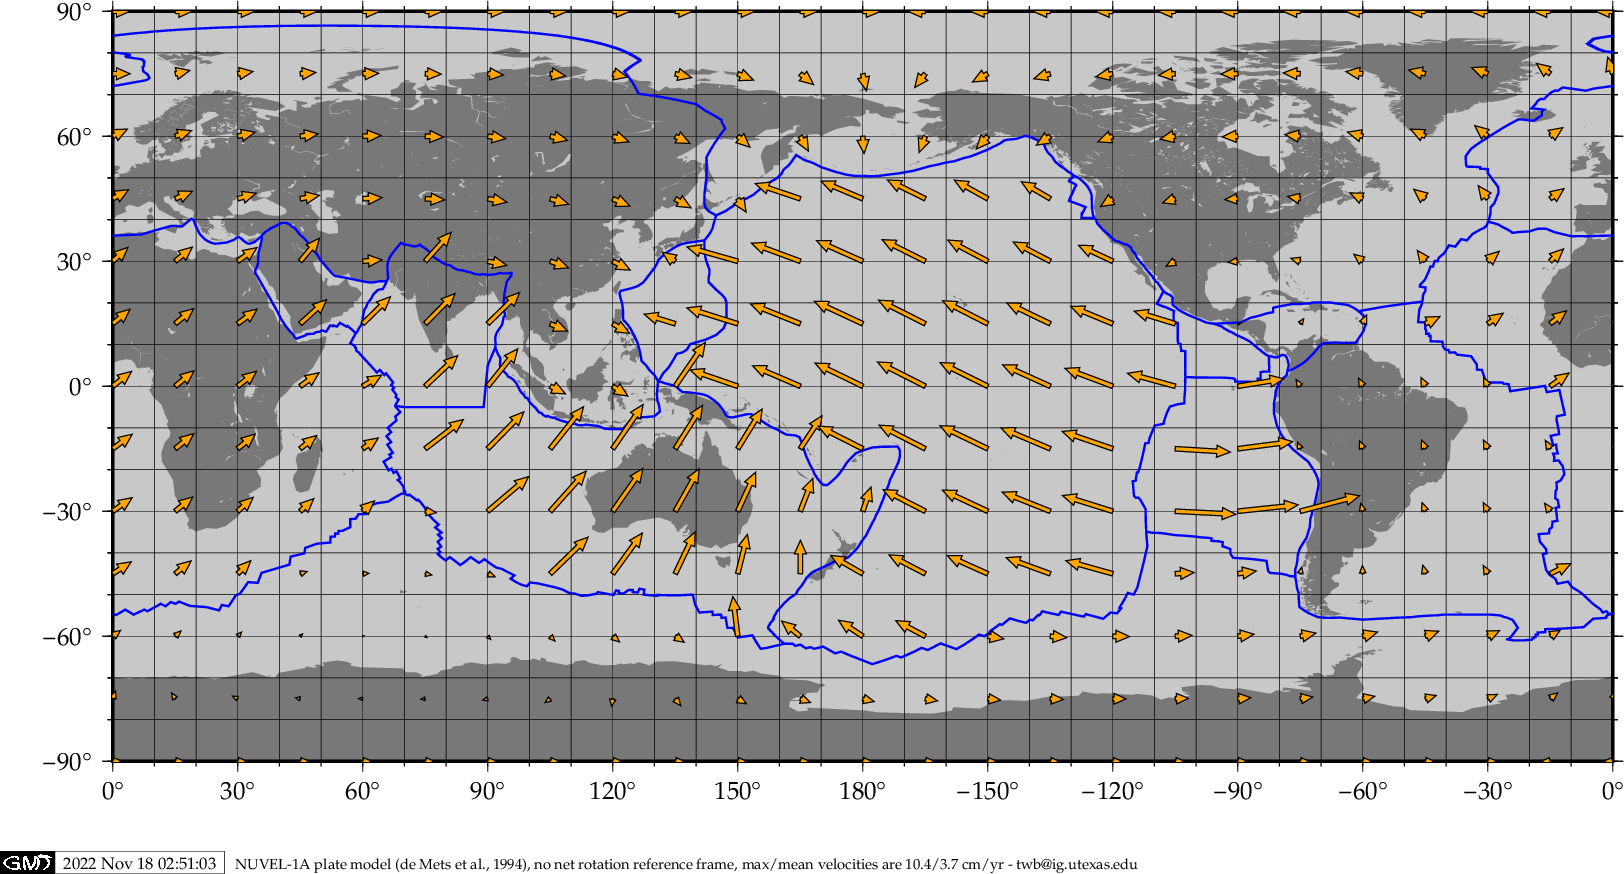
[PDF] [PNG] [PDF] [PNG] 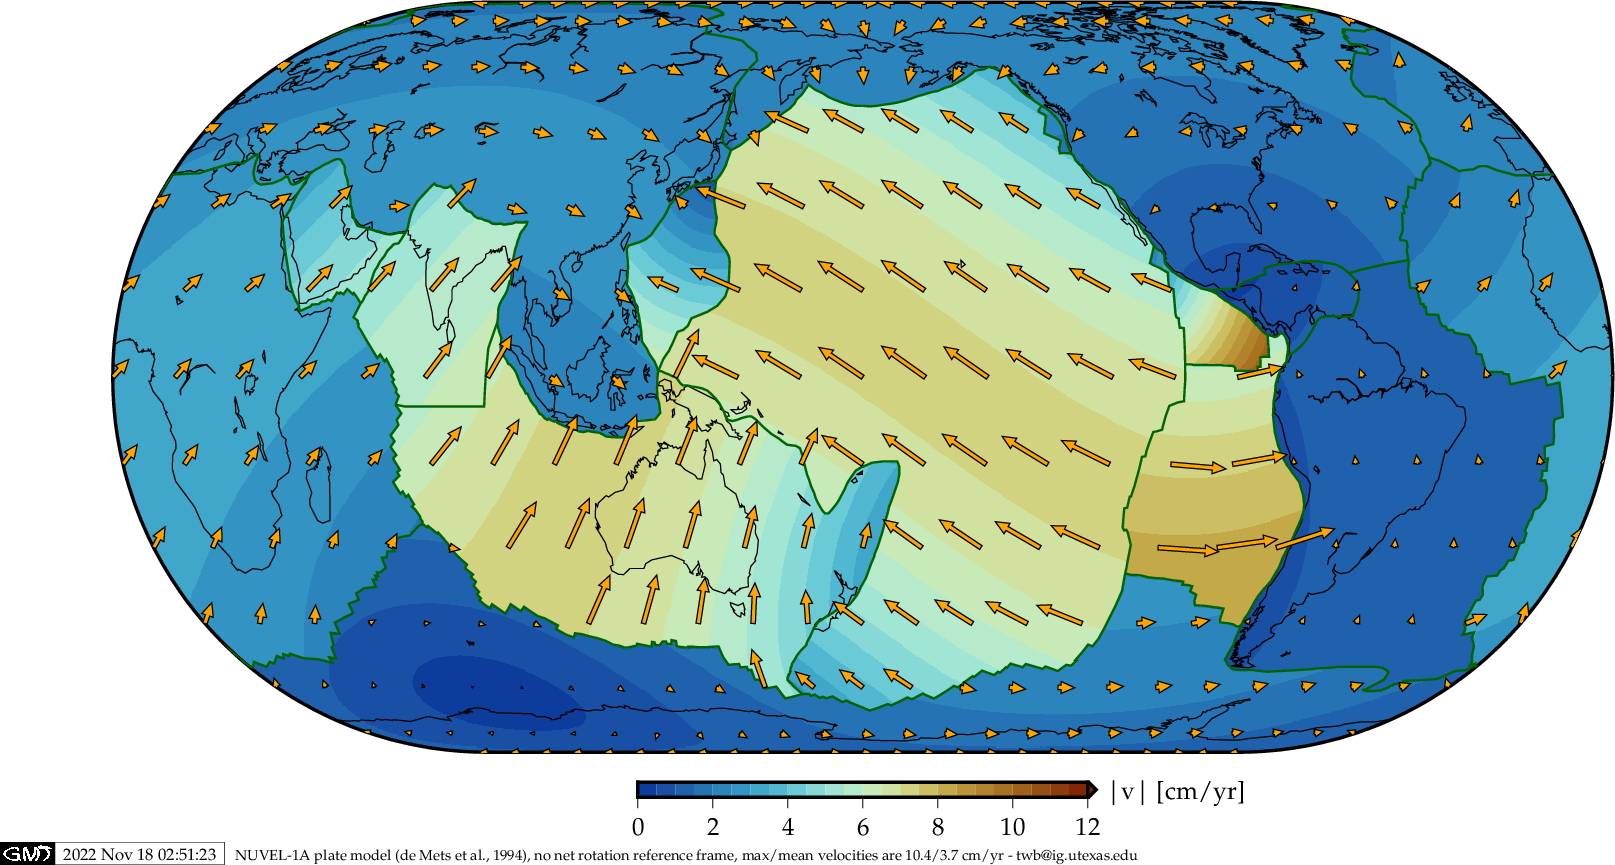
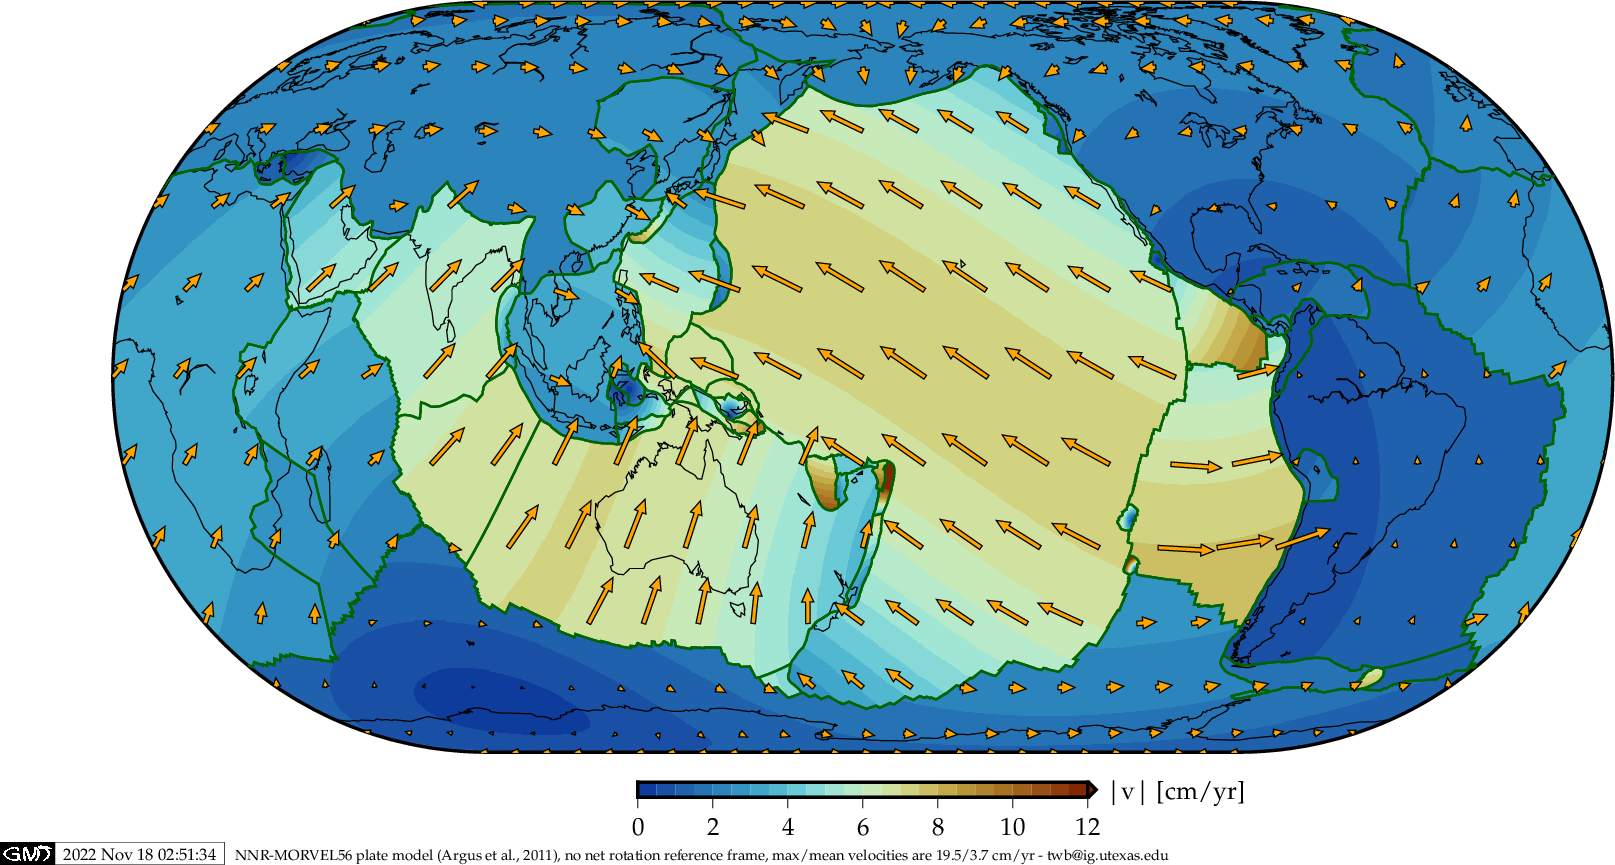
[PDF] [PNG] [PDF] [PNG] Spreading aligned (Becker et al., 2015) reference frame 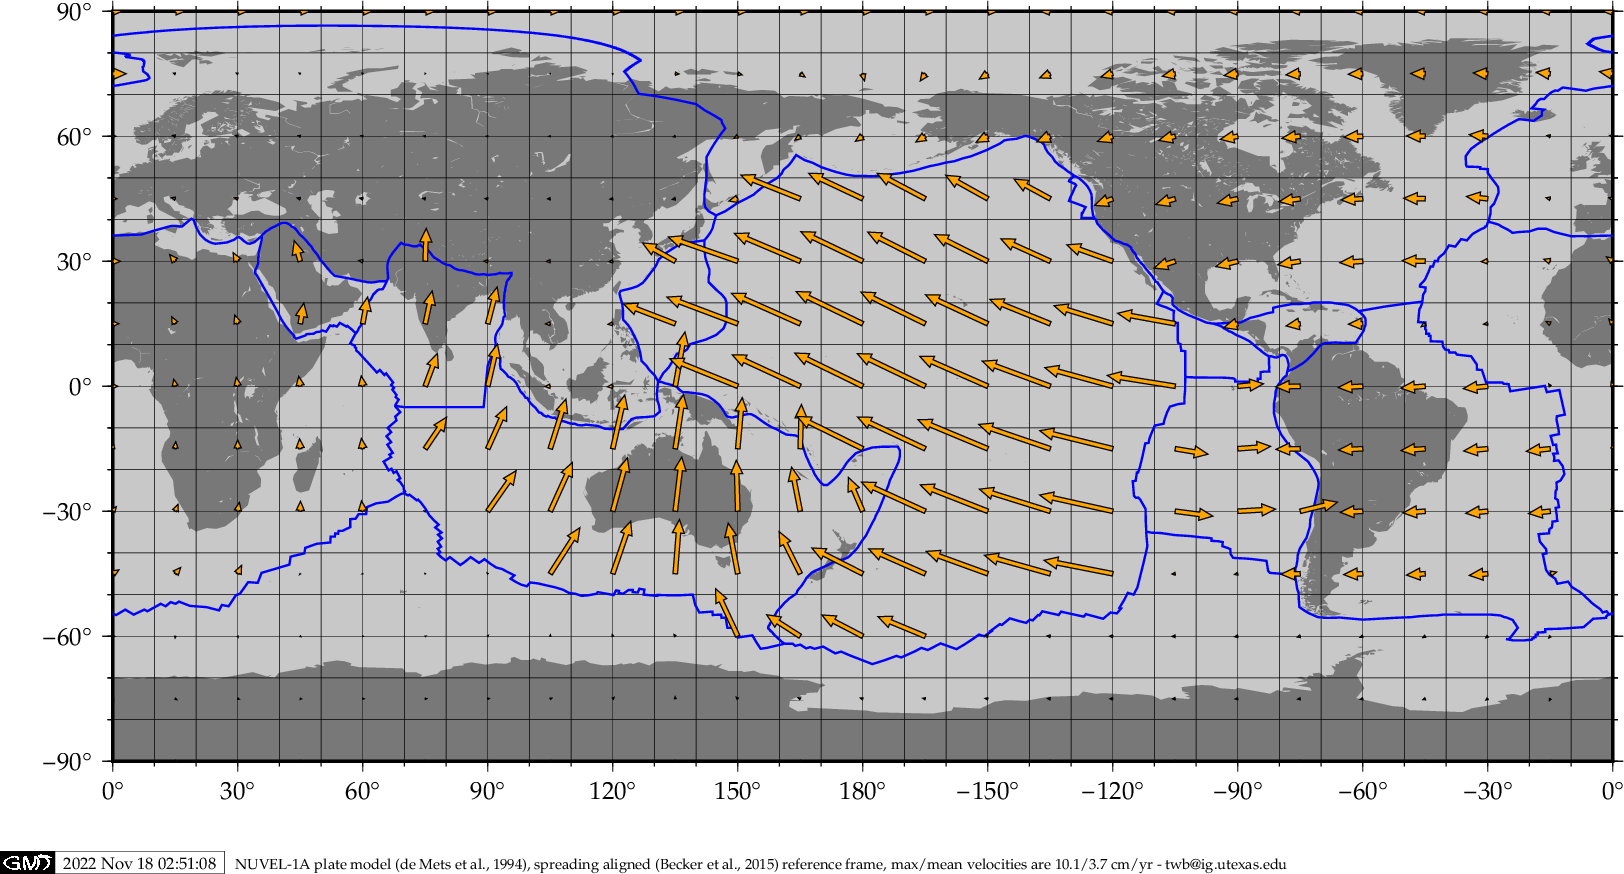
[PDF] [PNG] [PDF] [PNG] 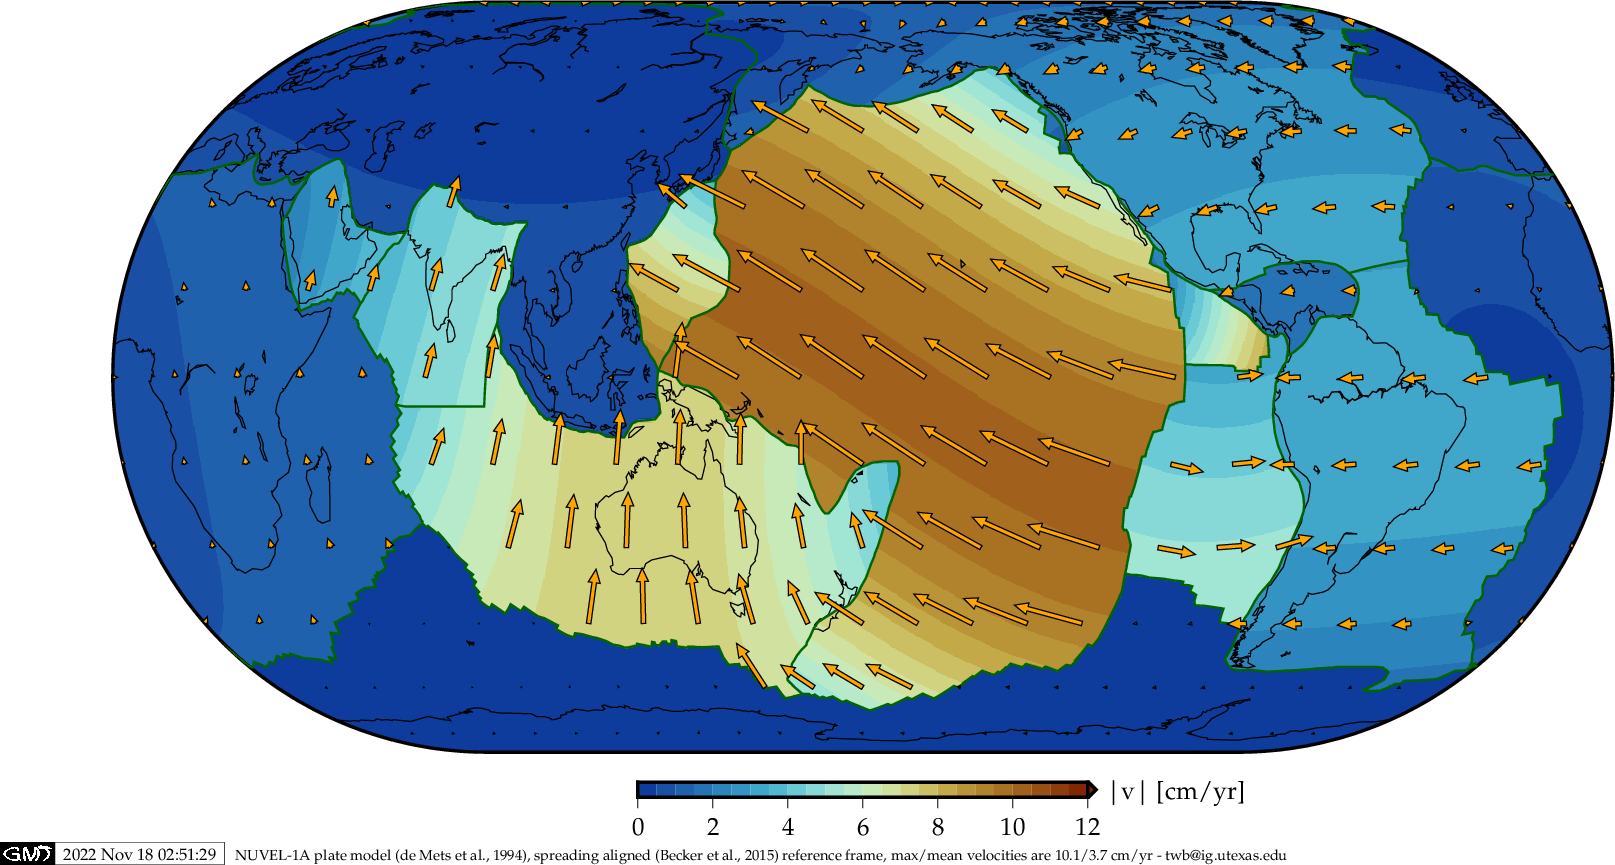
[PDF] [PNG] [PDF] [PNG] - Argus, D. F., Gordon, R. G., & DeMets, C. (2011). Geologically current motion of 56 plates relative to the no-net-rotation reference frame. Geochem., Geophys., Geosys., 12(11).
- Becker, T. W., Schaeffer, A. J., Lebedev, S., & Conrad, C. P. (2015). Toward a generalized plate motion reference frame. Geophys. Res. Lett., 42, 3188-3196.
- DeMets, C., Gordon, R. G., Argus, D. F., & Stein, S. (1994). Effect of recent revisions to the geomagnetic reversal time scale on estimates of current plate motions. Geophys. Res. Lett., 21, 2191-2194.
- Global seafloor age from Mueller et al. (2008) for the
present-day
See also the animation of inferred Cenozoic seafloor age variations.
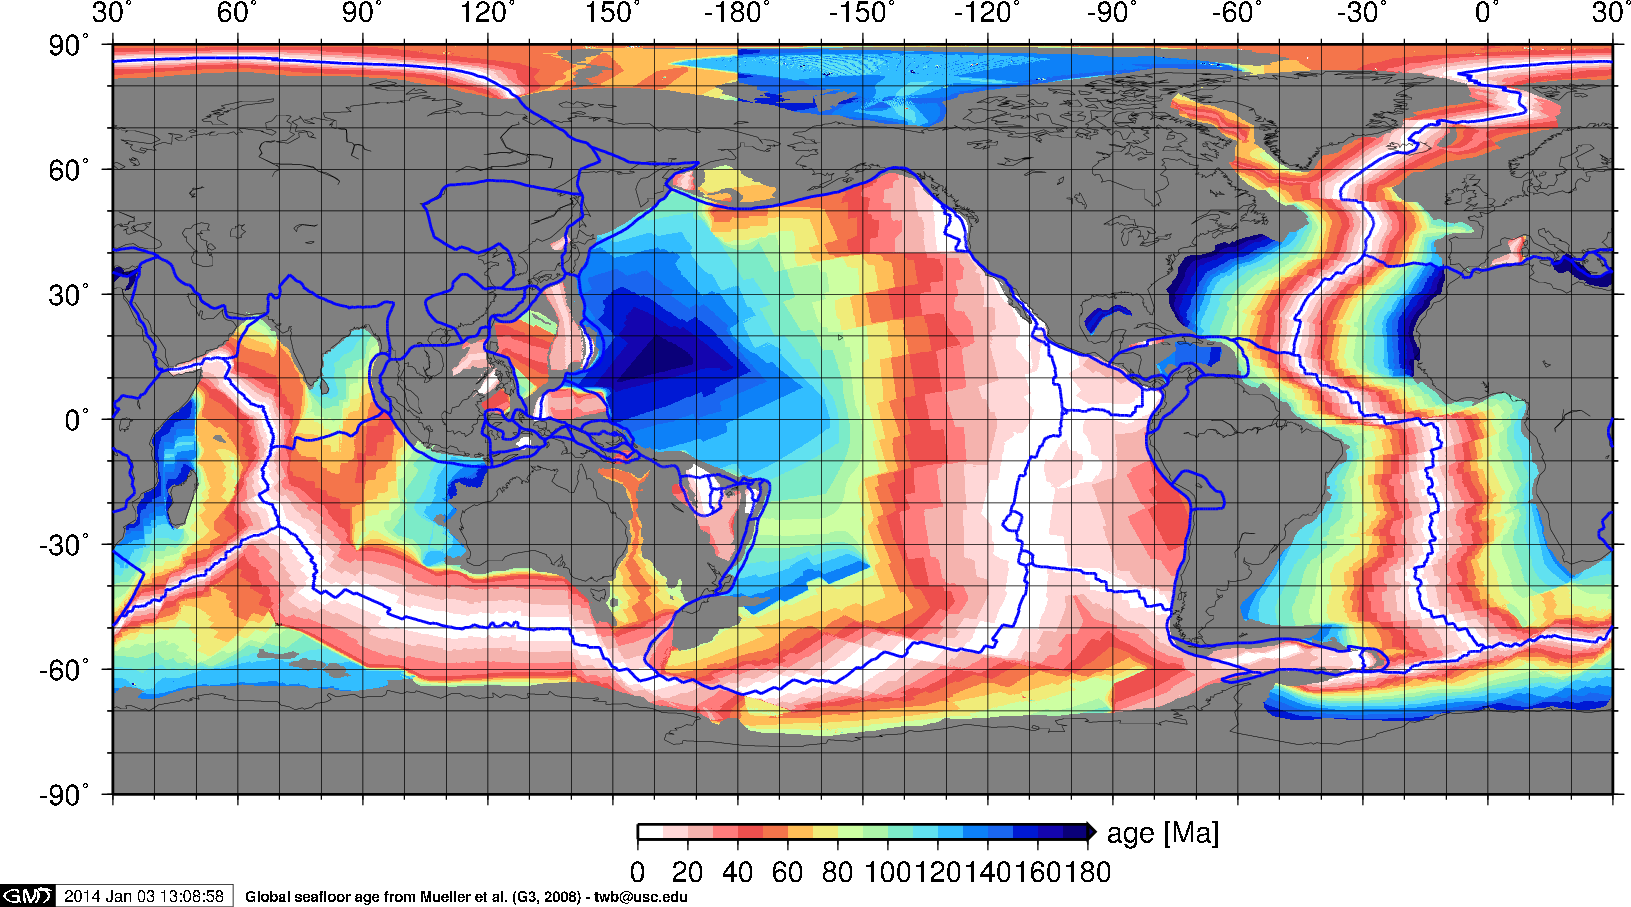
[PDF] [PNG] - Plate reconstructions with reconstructed seafloor age
- Simple animation with convergent margins
- Mueller et al. (2016)
- New complex animations, showing velocity amplitudes (NNR frame),
reconstructed age, poloidal, and toroidal surface velocities
- Seton et al. (2012)

- Matthews et al. (2016), corrected for Torsvik et al. (2019), ages computed by Krister Karlsen, reconstruction
provided by Clint Conrad
- Mueller et al. (2016)
- Mueller et al. (2019)

- Mueller et al. (2022)

- Seton et al. (2012)
- Old animations
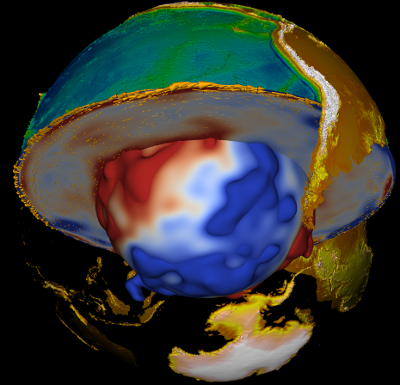
- Three dimensional visualizations
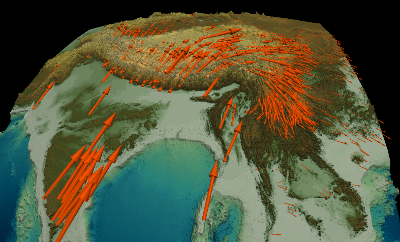
- Global and regional lithospheric deformation styles from moment tensors
- Simple animation with convergent margins


[news] [research] [teaching] [team] [publications] [CV] [contact]
downloads:
[SKS compilation] [APM model] [LPO model]
[lecture notes] [papers]