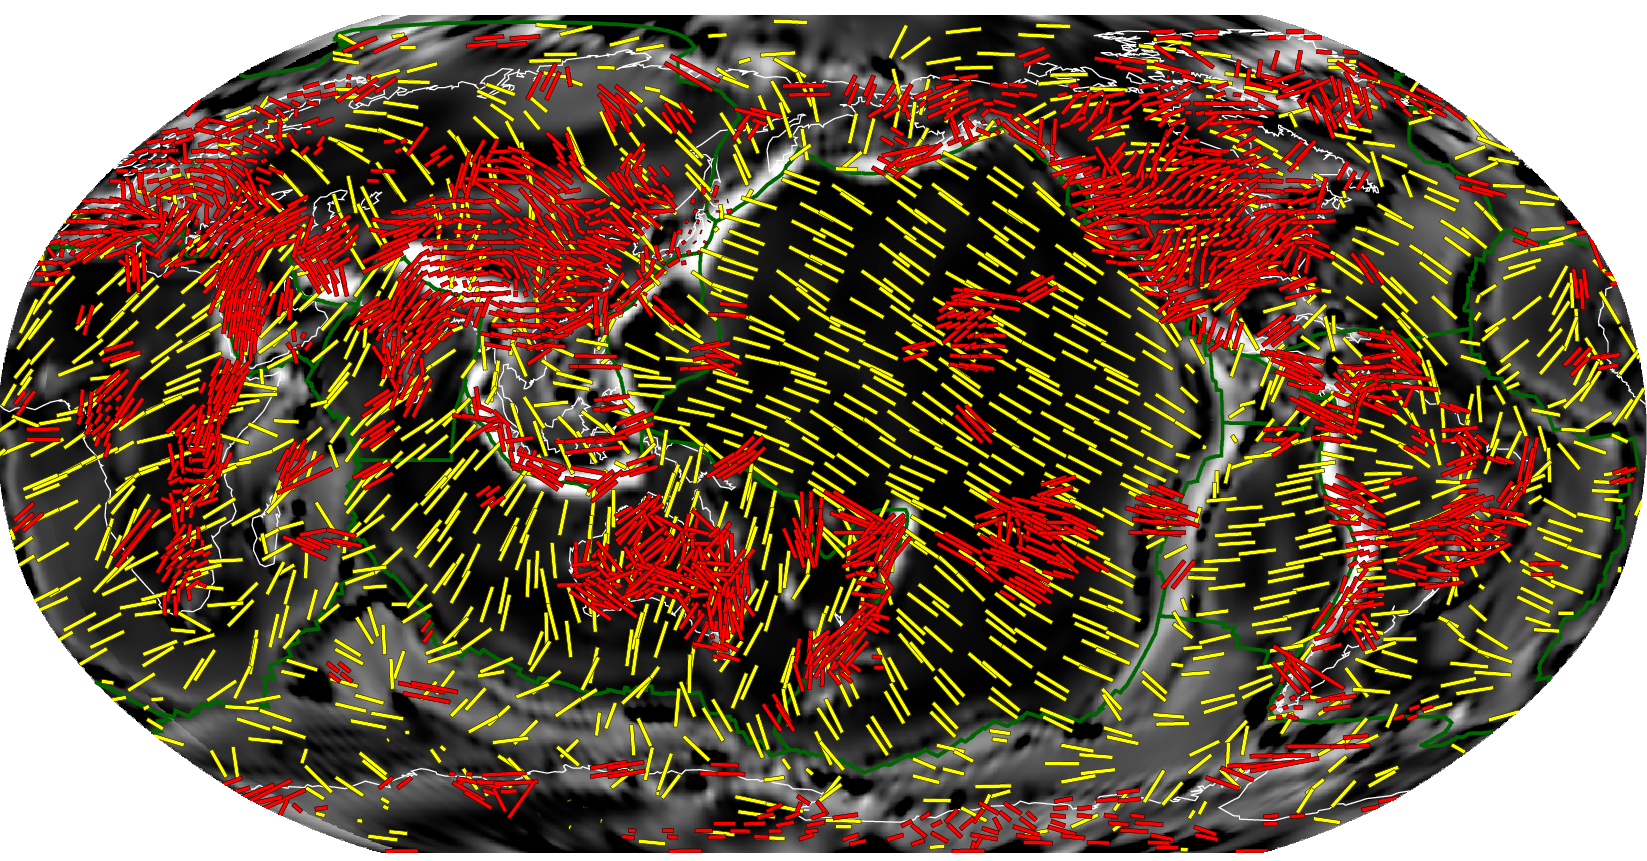
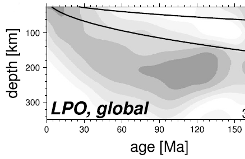
Upper mantle, seismic anisotropy from LPO and mantle flow model
Here are global plots
and model data files from our
seismic anistropy models for the upper mantle. Models are based on the
formation of lattice preferred orientation (LPO) textures of
olivine/enstatite during asthenospheric flow, and model I below was
recently reevaluated in light of azimuthal anisotropy by
Becker et al. (2014) and for radial
anisotropy by Auer et al. (2015)
(Additional notes.)
Model I
Best-fit model (safs417nc3_er) of Becker et al. (2008).
Velocity fields for the flow model
We provide a low resolution, Netcdf/GMT grd representation of
velocities of the actual flow model on which LPO computations
are based in this gzipped tar file
safs417nc3_er.vel.tgz.
The files are v[rtp].i.grd for spherical coordinates r, theta,
phi velocities (cm/yr) at i = 1, 2,...44 layers depth, sorted
bottom up with depth in km given in the file vdepth.dat. The
er.*grd files quantify the degree to which deformation was in
the dislocation vs. diffusion creep regime
(cf. Becker, 2006)
and are needed to reproduce the LPO computation.
Horizontal projection of fast axes for azimuthal
anisotropy/SKS
 SKS splitting, for example, results from a non-linear
averaging over the anisotropic elasticity tensor along the path (e.g.,
Becker
et al., 2012). However, simplified representations can be compared
with azimuthal anisotropy estimates. Here, we use the best fit
hexagonal approximation of the tensor (transverse isotropy, TI,
computed as in Browaeys and Chevrot, 2004), projected into the
horizontal, and expressed in %.
-
- Model data files are given at the same depth levels as above (50, 100,
..., 350 km):
Data are in format:
lon lat depth(km) ...
V_11 V_12 V_13 ... V_16 ...
V_22 V_23 ... V_26 ...
V_33 V_34 ... V_36 ...
V_44 ... V46 V_55 V_56 V_66
where V is the Voigt matrix representation of the elasticity
tensor (in the convention of Browaeys and Chevrot, 2004, for example),
given in upper triangle representation, units of GPa.
The fstrack software package contains
a number of program to process elasticity tensors in the sav format
from above. For example, the best-fit TI axes were computed
with sav2decompose.
-
This particular LPO from flow model incorporates lateral viscosity
variations in the mantle and uses dislocation/diffusion creep
rheologies; it was found to match global, seismologically determined
radial anisotropy averages by
Becker
et al. (2008), see, e.g., their Fig. 7c.
The LPO model also matches seismologically imaged patterns of
azimuthal and radial anisotropy well globally as inferred from
large-scale surface-wave imaging. It can therefore in some sense be
considered a reference model for the LPO-induced seismic anisotropy
from mantle flow in the upper mantle
(Becker et al., 2014,
Auer et al., 2015), subject to further
refinement.
In particular, the flow model does not include smaller-scale
density anomalies, such as underneath North America, or any intraplate
plate deformation, or microplate motions, on scales smaller than the
plates of the NUVEL model. This model also only captures the active
mantle flow component of LPO anisotropy formation, and layers
shallower than ~100 km will have little anisotropy in the
model. Frozen-in anisotropy in reality may be important at those
depths
(Becker
et al., 2008).
The actual anisotropy is based on Kaminski et al.'s (2004) DREX
method and assigning pressure and temperature dependent single crystal
tensors before averaging
(Becker et al.,
2006), and therefore consists of
the full, 21 independent elastic
tensor components.
References
-
Becker, T. W., Chevrot, S., Schulte-Pelkum, V.,
and Blackman, D. K.: Statistical properties of seismic anisotropy
predicted by upper mantle geodynamic models. J. Geophys. Res.,
111, B08309, doi:10.1029/2005JB004095, 2006.
-
Becker, T. W., Kustowski, B., Ekström, G.:
Radial seismic anisotropy as a constraint for upper mantle rheology.
Earth Planet. Sci. Lett., 267, 213-237, 2008.
-
Becker, T. W., Lebedev, S., and Long, M. D.: On the relationship
between azimuthal anisotropy from shear wave splitting and surface
wave tomography. J. Geophys. Res., 117, B01306,
doi:10.1029/2011JB008705, 2012.
-
Becker, T. W., Conrad, C. P., Schaeffer, A. J., and Lebedev, S.:
Origin of azimuthal seismic anisotropy in oceanic plates and mantle.
Earth Planet. Sci. Lett., 401, 236-250, 2014.
- Browaeys, J. T. and Chevrot, S.: Decomposition of the elastic tensor
and geophysical applications. Geophys. J. Int., 159, 667-678,
2004.
- Kaminski, E., Ribe, N. M., and Browaeys, J. T.: D-Rex, a program for
calculation of seismic anisotropy due to crystal lattice preferred
orientation in the convective upper mantle. Geophys. J. Int.,
158, 744-752, 2004.
|

